Maximum Drawdown: How to Calculate & Manage Risk

Maximum Drawdown: How to Calculate & Manage Risk
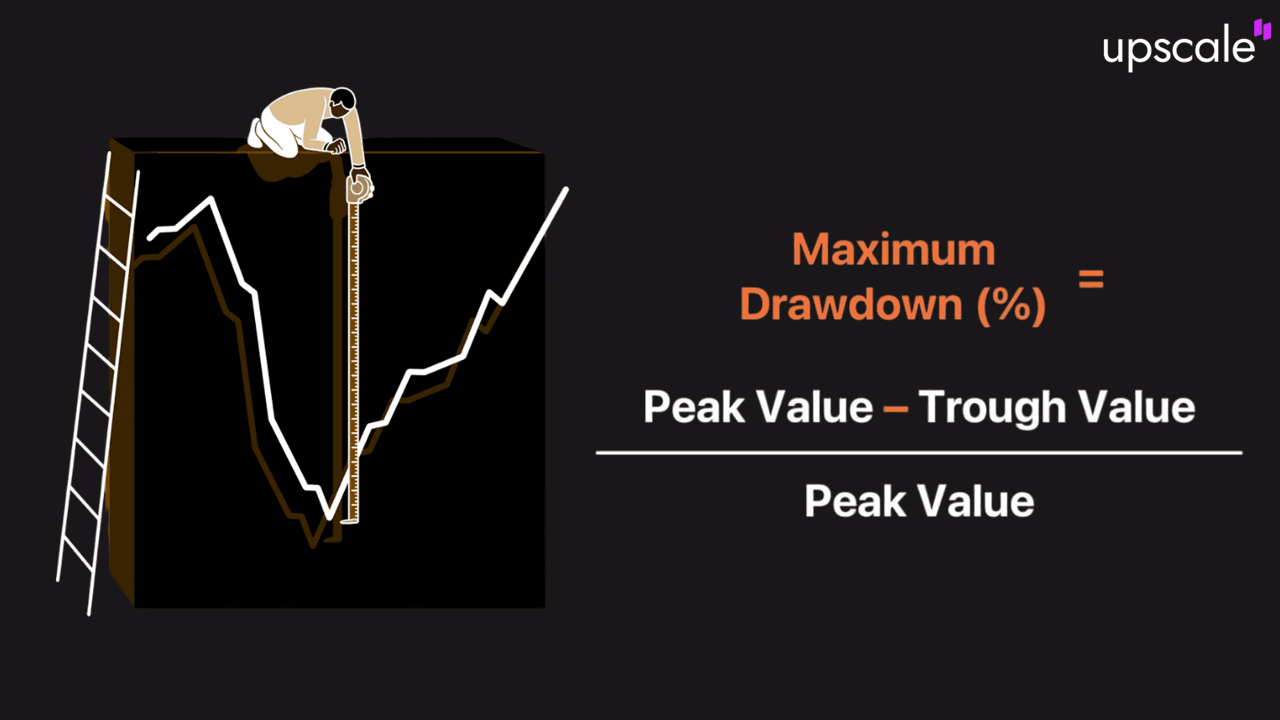
Maximum drawdown (MDD) is the largest peak-to-trough decline in portfolio value. Formula: (Trough Value - Peak Value) / Peak Value × 100. Portfolio dropping from $150,000 to $120,000 equals -20% MDD.
MDD measures the worst-case scenario for traders. Determines recovery requirements and proves essential for risk management. Professional traders monitor MDD alongside returns when evaluating strategy performance. Institutional investors use MDD to assess fund managers.
This guide covers calculation methods, real examples, comparison metrics, and reduction strategies. Understanding MDD separates sustainable trading from gambling. Your largest drawdown reveals more about strategy quality than your best winning streak.
Think of MDD as your portfolio's stress test. Shows exactly how much heat you can handle when markets turn cold. Every strategy faces drawdowns eventually. Question becomes: can you survive them psychologically and financially? Master this metric before scaling capital.
How to Calculate Maximum Drawdown
Maximum drawdown calculation follows four systematic steps with precise methodology. Accuracy matters because MDD determines risk limits in funded accounts.
- Step 1: Track portfolio values at regular intervals. Daily or weekly recording captures all movements accurately. Monthly snapshots miss intraday volatility and underestimate true MDD.
- Step 2: Identify all peak values where the portfolio reached new highs. Each new peak starts potential drawdown measurement. Multiple peaks occur throughout trading history. Each requires separate evaluation.
- Step 3: Find lowest trough following each peak before next new high. Trough represents maximum decline from that specific peak. Recovery to new high ends that drawdown period. Next decline starts fresh drawdown measurement.
- Step 4: Calculate (Trough - Peak) / Peak × 100 for each peak-trough pair. Select most negative result as MDD. This represents worst historical decline from any peak.
 Detailed worked example demonstrates calculation: Portfolio reaches $500,000 peak on June 15. Declines to $350,000 trough by August 3. Recovers to $450,000 by September but never exceeds the original $500,000 peak. Calculation: ($350,000 - $500,000) / $500,000 × 100 equals -30% MDD.
Recovery to $450,000 doesn't end the drawdown period. Portfolio remains -10% below peak even after partial recovery. Only reaching a new high above $500,000 closes drawdown and starts a fresh measurement cycle.
Common mistake: calculating from starting balance instead of highest peak value. MDD always measured from peak, not initial investment. This distinction becomes critical after account growth.
Clarification example: Account starts at $100,000 on January 1. Grows to $150,000 peak by March 15. Drops to $120,000 by May 30. MDD equals -20% from $150,000 peak. Not -20% from initial $100,000. Starting balance becomes irrelevant after growth occurs.
Another example demonstrates multiple drawdown periods: Account starts at $100,000. Grows to $140,000 (first peak), drops to $120,000 (first trough = -14.3% drawdown). Recovers and grows to $160,000 (new peak), drops to $130,000 (second trough = -18.75% drawdown). MDD equals -18.75% (larger of two drawdowns).
This distinction matters significantly. Peak represents the highest portfolio value achieved. Measuring from peaks captures true risk exposure at each point. Proper MDD calculation requires tracking all peaks and troughs throughout entire trading history.
Real-World Maximum Drawdown Examples
Historical benchmark data provides context for typical MDD ranges. Recent examples show real market conditions and recovery dynamics.
COVID-19 Crash (2020)
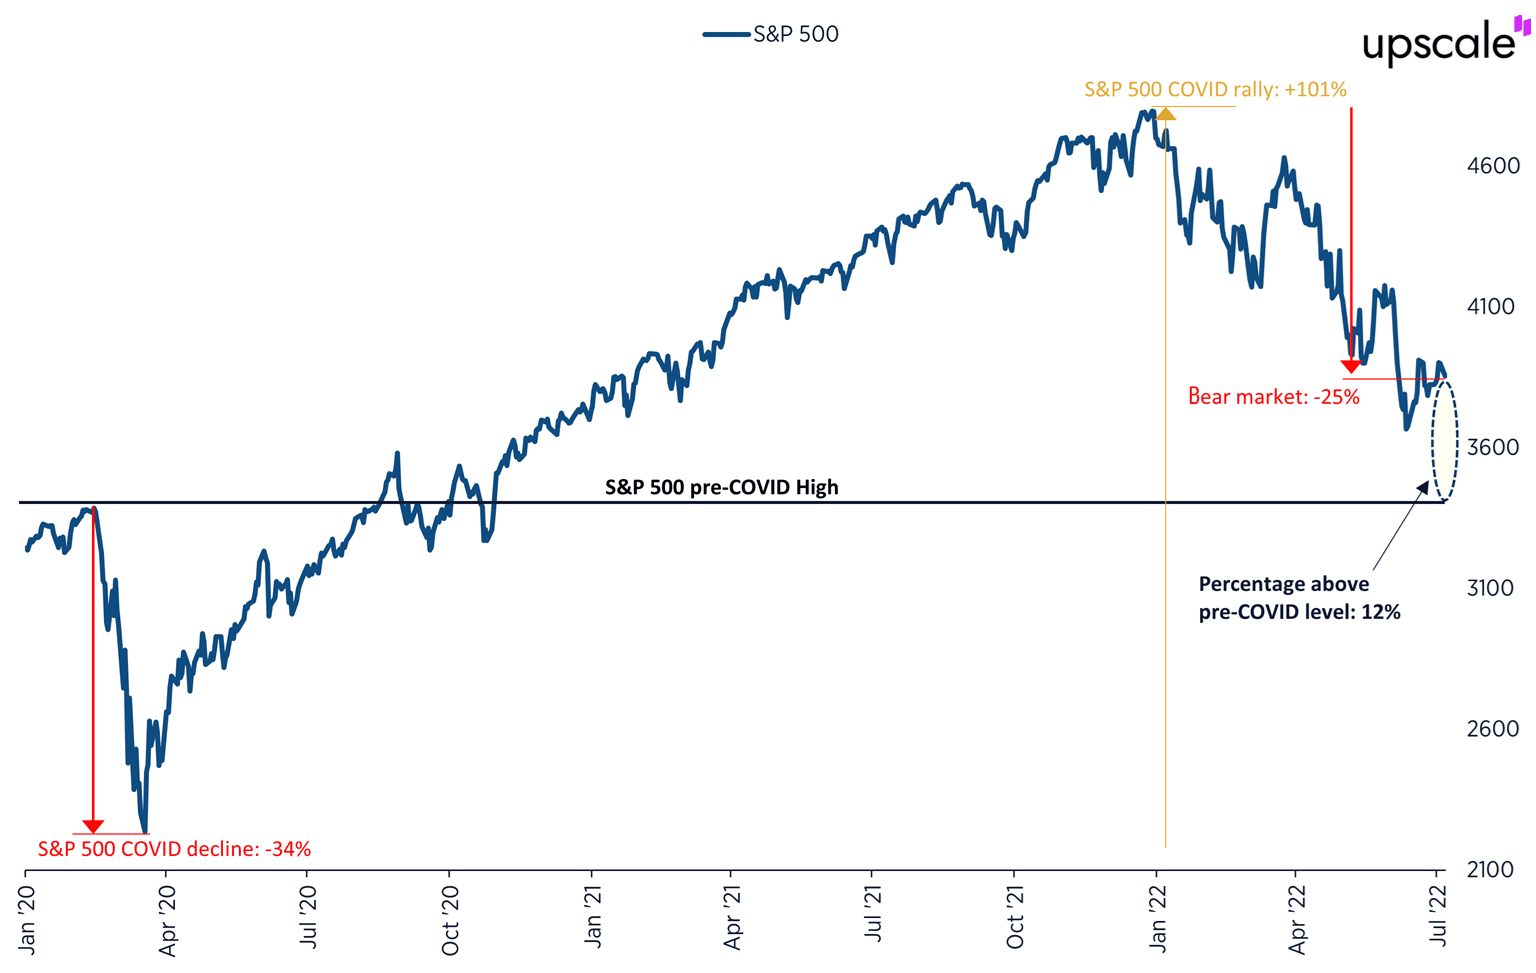
S&P 500 experienced -34% MDD from February 19, 2020 peak (3,386 points) to March 23, 2020 trough (2,237 points). Fastest recovery in history occurred. Return to new highs took just 5 months by August 18, 2020.
Entire crash lasted only 32 days peak-to-trough. Showcased extreme volatility capability modern markets possess. Federal Reserve intervention and fiscal stimulus drove rapid bounce. V-shaped recovery defied historical precedent.
Lesson: Even worst crashes can recover quickly with proper policy response. Traders selling at trough locked permanent losses. Those maintaining positions through volatility recovered fully.
2022 Bear Market
S&P 500 suffered -25.4% MDD from January 3, 2022 peak ($4,818) to October 12, 2022 trough ($3,577). Fed rate hikes and inflation concerns drove sustained decline. Recovery to new highs took until January 2024.
This drawdown demonstrated different characteristics. Slow grinding decline versus rapid crash. Multiple failed rallies trapped optimistic buyers. Duration created psychological challenge testing patience severely.
Sector Comparison and Recovery Mathematics
Nasdaq 2022 suffered -36% MDD showing technology sector vulnerability. Individual stocks face even larger declines. Netflix dropped -77% from peak. Meta declined -74% during the same period.
These examples show individual stock risk exceeds index risk substantially. S&P 500 declined -25% while the average component dropped -40%+. Diversification reduces MDD significantly.
Recovery mathematics creates an asymmetric challenge. 50% loss requires 100% gain to break even. Breakdown by size:
- 10% loss needs 11.1% gain
- 20% loss needs 25% gain
- 30% loss needs 42.9% gain
- 50% loss needs 100% gain
- 75% loss needs 300% gain
Strategy generating 20% annual returns needs 5 years recovering from 50% drawdown. The same strategy recovers from a 20% drawdown in approximately 1 year.
These recent drawdowns show why prop firms enforce strict 10% limits. Protects both capital and psychological resilience. Smaller drawdowns enable faster recovery.
Maximum Drawdown vs Other Risk Metrics
MDD-based metrics complement volatility-based measures for complete risk assessment.
Calmar Ratio
Calmar Ratio equals Annual Return divided by MDD. Measures return per unit of drawdown. Values above 2.0 indicate strong risk-adjusted performance.
Example calculation: 25% annual return with 12% MDD equals Calmar 2.08. Excellent risk-adjusted performance demonstrated.
Sharpe Ratio Comparison
Sharpe Ratio uses standard deviation (volatility) instead of MDD as denominator. Sharpe above 1.0 equals acceptable performance. Above 2.0 equals very good performance.
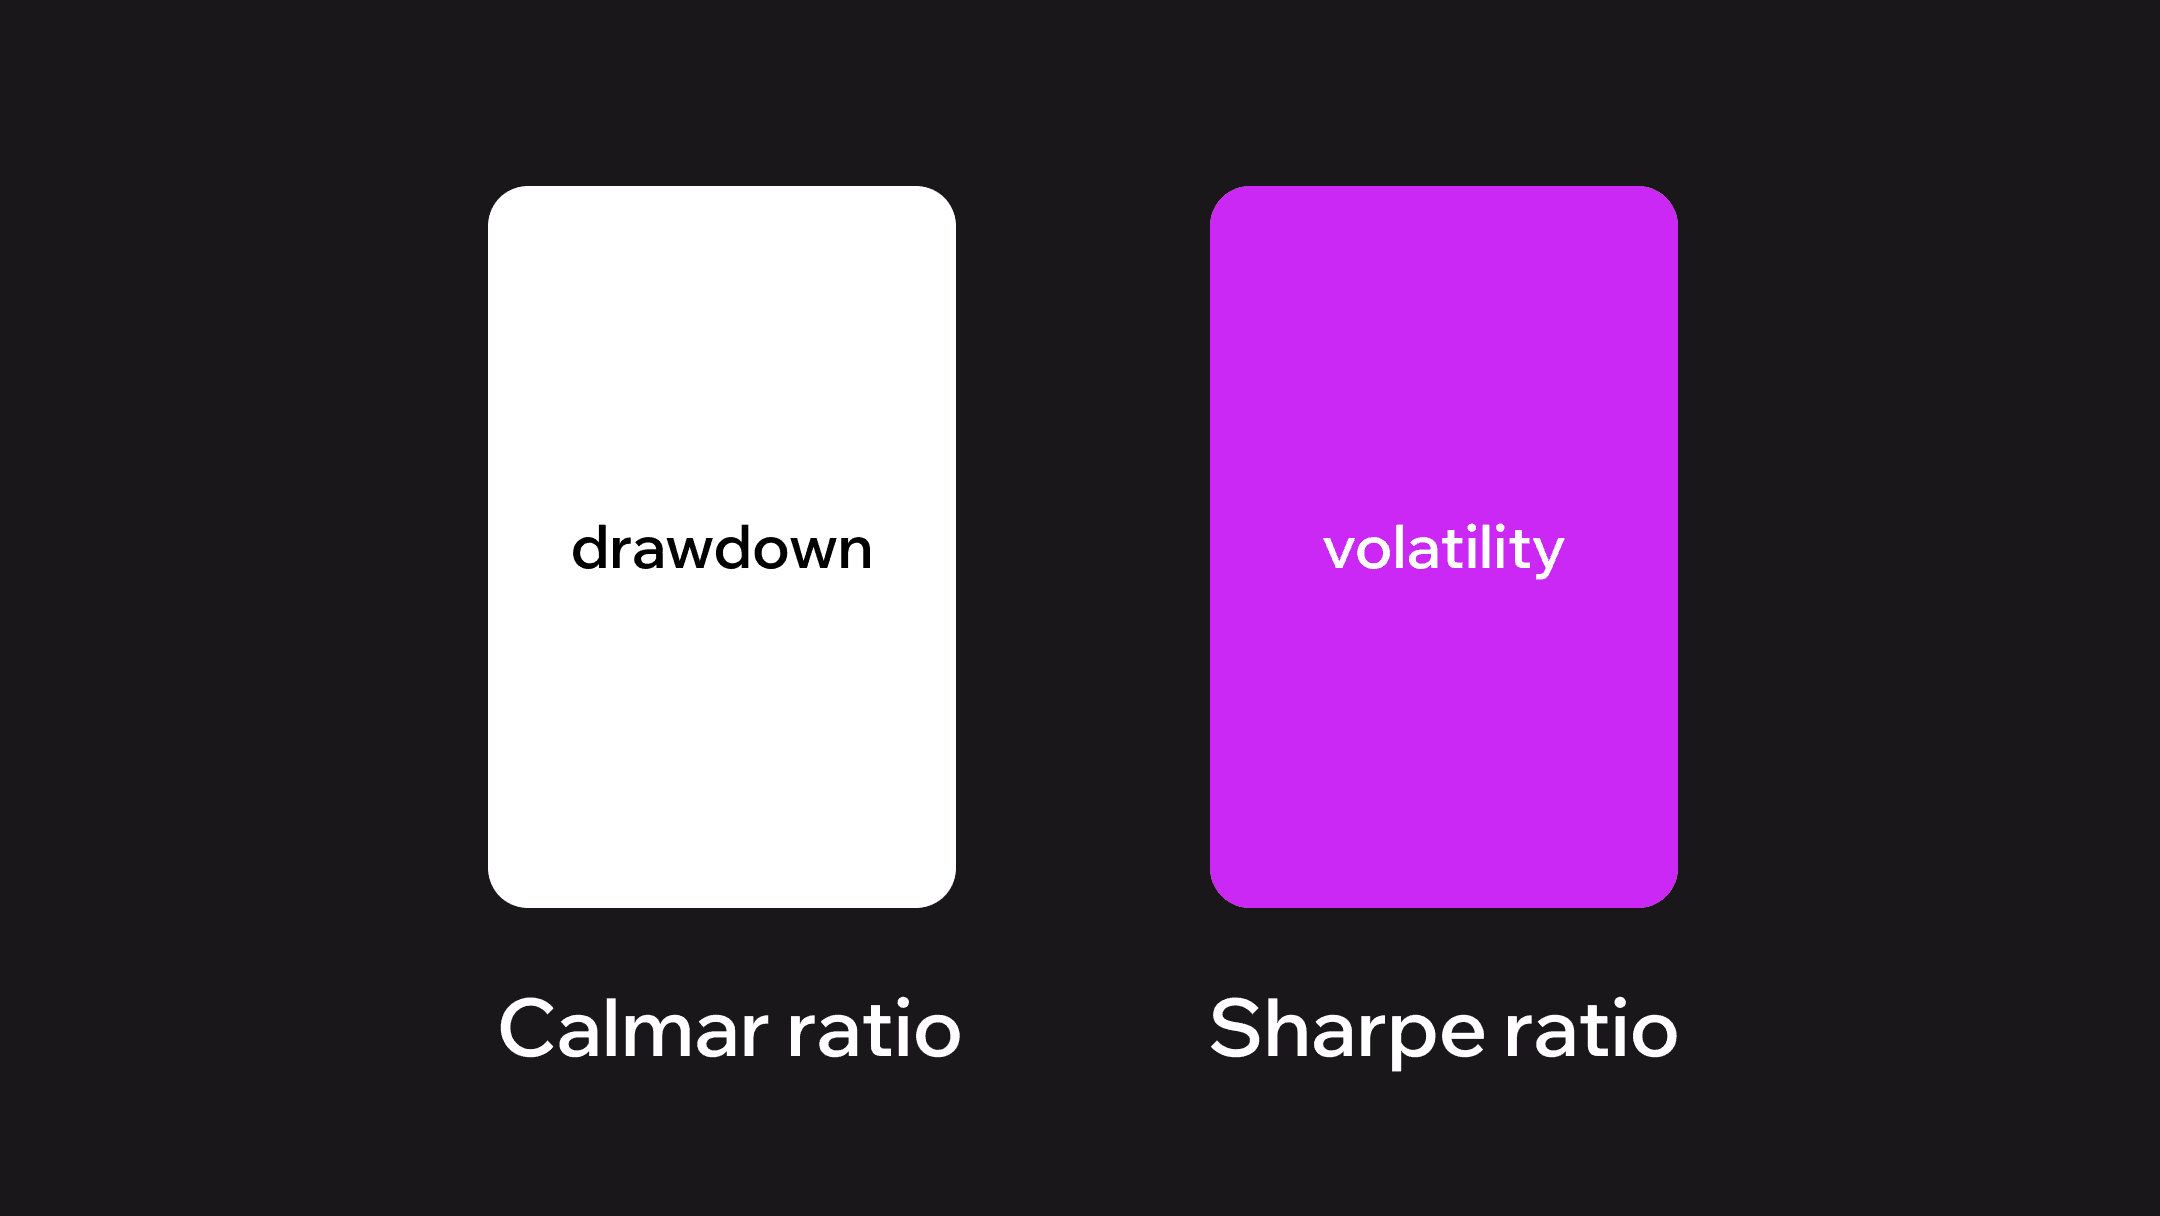 Key distinction: Calmar focuses on downside risk (actual losses), Sharpe measures total volatility (up and down moves). Different perspectives reveal different insights.
Practical Application
Calmar works better for drawdown-sensitive contexts like prop trading. Maximum loss limits exist in funded accounts. MDD directly measures against these limits.
Use both metrics together for a complete picture. High Sharpe with low Calmar signals a volatile path to returns. Severe drawdowns occurred despite a positive overall volatility profile.
3 Strategies to Minimize Maximum Drawdown
Practical risk management techniques reduce MDD effectively. Implementation requires discipline but results prove worthwhile.
Strategy 1: Position Sizing
Risk 1-2% per trade maximum creates mathematical protection. $100,000 account risking 2% per trade needs 10 consecutive losses before reaching 20% drawdown. Unlikely with proper edge.
Conservative approach uses 1% risk per position. Requires 20 straight losses for 20% drawdown. Virtually impossible with a positive expectancy system.
Calculation example: $100,000 account with 1.5% risk per trade. Single trade risks $1,500 maximum. $50 stock with $2 stop distance allows 750 shares ($1,500 / $2).
Many traders violate position sizing during winning streaks. Confidence grows after successes. Position sizes increase unconsciously. Single large loss wipes multiple small gains.
Strategy 2: Trailing Stop Losses
Lock profits as positions move favorably. Reduces peak-to-trough distance automatically. Example: trade gains 15%. Set trailing stop at +10% profit level. Guarantees 10% profit capture even if reversal occurs.
Implementation: Enter $100 stock position. Stock rises to $115 (+15%). Place trailing stop at $110. Stock continues to $120. Stop adjusts to $115. Stock reverses to $115. Exit with +15% profit secured.
Strategy 3: Diversification
Hold 6-10 uncorrelated positions preventing simultaneous drawdowns. One sector crash doesn't sink the entire portfolio. Independent price movements create natural hedge.
Correlation matters more than quantity. Ten correlated positions offer little protection. Six truly uncorrelated positions provide substantial risk reduction. Correlation coefficient below 0.5 indicates sufficient independence.
Example: Portfolio holds technology stocks, energy commodities, treasury bonds, international equities, real estate. Technology crash doesn't impact energy simultaneously.
Combined Effect
Trader using all three strategies together: 1.5% position sizes plus trailing stops plus 8-position diversification. Historical result: 12% MDD versus 28% without risk controls over a five-year period.
Risk management isn't about avoiding losses. It's about surviving inevitable drawdowns to trade when your edge returns.
What is a Good Maximum Drawdown?
Strategy-specific MDD benchmarks provide realistic targets. Context matters significantly for appropriate assessment.
Conservative Long-term Portfolios
Target 10-15% MDD for wealth preservation strategies. Traditional 60/40 stock-bond allocation historically achieves 15-20% MDD during bear markets. All-equity portfolios experience 30-50% drawdowns during severe corrections.
Example: Portfolio targeting 8% annual returns with 12% maximum drawdown. Conservative positioning accepts lower upside for downside protection.
Swing Trading
20-30% acceptable due to multi-day position exposure. Overnight gaps and extended holding periods create higher drawdown potential. Swing traders accept larger drawdowns for larger profit targets.
Example: Average hold time 5-7 days. Position sizing 2% risk per trade. Historical MDD 24% over a three-year period. Acceptable given 35% annual return achieved.
Day Trading
Below 10% MDD expected given intraday timeframes. Overnight risk avoidance eliminates gap exposure. Positions closed before market close limit cumulative losses naturally.
Example: Only intraday positions. Stop losses 0.5-1% per trade. Maximum 3% daily loss limit self-imposed. Historical MDD 7% over a two-year period.
Prop Trading Specific
Strict 5% daily and 10% total limits enforced by funded account providers. Breach triggers immediate suspension. Protects firm capital while testing trader's risk discipline.
Firm provides $100,000 capital. 10% limit caps the firm's maximum loss at $10,000 per account. 5% daily limit prevents single-day catastrophic loss. Most prop traders fail due to drawdown violations rather than lack of profits.
Personal Tolerance Framework
Multiply MDD by account size to visualize actual dollar loss. $100,000 account with 20% MDD equals $20,000 decline. Can you stomach this psychologically?
Sleep quality test provides honest assessment. Drawdowns keeping you awake indicate threshold too high. Statistics become irrelevant if stress damages decision quality.
Your "good" MDD depends on personal psychological resilience. Some traders handle 30% drawdowns calmly. Others panic at 10%. Know yourself before setting targets.
Proving Your Drawdown Discipline with Funded Capital
Understanding maximum drawdown transforms from academic exercise to critical skill when trading substantial capital. Prop trading amplifies both opportunity and accountability. You need proven MDD management before scaling.
Visit Upscale.trade for funded accounts up to $100,000 where your MDD discipline determines success. Our challenge structure enforces strict risk limits: 5% daily drawdown maximum, 10% total drawdown limit.
These limits aren't arbitrary. They're designed to develop institutional-grade risk habits. Pass the evaluation demonstrating consistent MDD control. You'll trade our capital keeping 80% of profits.
Over 200 instruments available. Transparent profit splits. Your risk management skills. Our capital. Start your challenge and prove your drawdown discipline scales.
FAQ
What is an example of maximum drawdown?
Portfolio grows to $150,000 peak, declines to $120,000 before recovering. Calculation: ($120,000 - $150,000) / $150,000 × 100 equals -20% MDD. Recent examples: S&P 500 experienced -34% MDD during COVID-19 crash (February-March 2020) with 5-month recovery, and -25.4% MDD during 2022 bear market requiring 15 months to recover to new highs.
What does 5% drawdown mean?
5% drawdown means portfolio declined 5% from peak value. In prop trading, "5% daily drawdown limit" means losing 5% in single day triggers account suspension immediately. Example: $100,000 account dropping to $95,000 in one day breaches limit, resulting in immediate trading restriction regardless of overall account performance.
What is the difference between max loss and max drawdown?
Max loss equals largest single trade or position loss in isolation. Maximum drawdown equals largest cumulative peak-to-trough portfolio decline over time, including multiple trades and market moves. MDD considers entire equity curve evolution tracking all gains and losses. Max loss focuses on individual position outcomes independently.
Why is max drawdown important?
MDD reveals worst capital loss requiring psychological endurance and recovery time. Large drawdowns need disproportionate returns to recover: 50% loss requires 100% gain to break even, creating asymmetric recovery challenge. MDD helps assess strategy sustainability, compare risk-adjusted performance via Calmar Ratio, and determine appropriate position sizing for capital preservation.
How do I calculate maximum drawdown?
Four steps: (1) Track portfolio values at regular intervals (daily or weekly), (2) Identify all peak values where portfolio reached new highs, (3) Find lowest trough after each peak before next high, (4) Calculate (Trough - Peak) / Peak × 100 for each peak-trough pair, select most negative result as MDD. Always measure from peak, not initial investment.
Is max drawdown always negative?
Yes, MDD always negative or reported as absolute percentage understood as loss. Formula (Trough - Peak) / Peak produces negative number since trough value lower than peak value. 0% MDD (no decline from peak) theoretically possible but extremely rare in active trading. Even best strategies experience periodic declines from highs.
How long does it take to recover from a drawdown?
Recovery time depends on drawdown size and strategy returns. 20% drawdown needs 25% gain to break even. 50% drawdown requires 100% gain to recover. With 15% annual returns, recovering from 50% MDD takes approximately 5 years. Recovery mathematics creates asymmetric challenge: larger drawdowns exponentially increase required recovery time and percentage gains.
