What is Put Call Ratio and How to Calculate It?

What is Put Call Ratio and How to Calculate It?
Put call ratio reveals market sentiment through options trading activity. This powerful indicator helps traders identify potential market reversals. Master PCR analysis for smarter trading decisions across traditional and crypto markets.
Meaning of Put Call Ratio (PCR)
Put call ratio measures market sentiment by comparing put options volume to call options volume traded. This mathematical relationship provides objective insight into trader positioning and market psychology. Market participants use PCR to gauge collective bullish or bearish sentiment.
Think of PCR as the market's emotional thermometer. When traders buy more puts than calls, they expect prices to fall. When call volume exceeds put volume, optimism dominates. This creates measurable sentiment patterns.
Put options give holders the right to sell assets at specific prices. Call options provide rights to buy assets at predetermined levels. The ratio between these volumes reveals aggregate market expectations.
Professional traders monitor PCR across different timeframes. Daily PCR captures immediate sentiment shifts. Weekly PCR smooths short-term noise. Monthly PCR reveals sustained positioning changes.
Put Call Ratio in Simple Terms
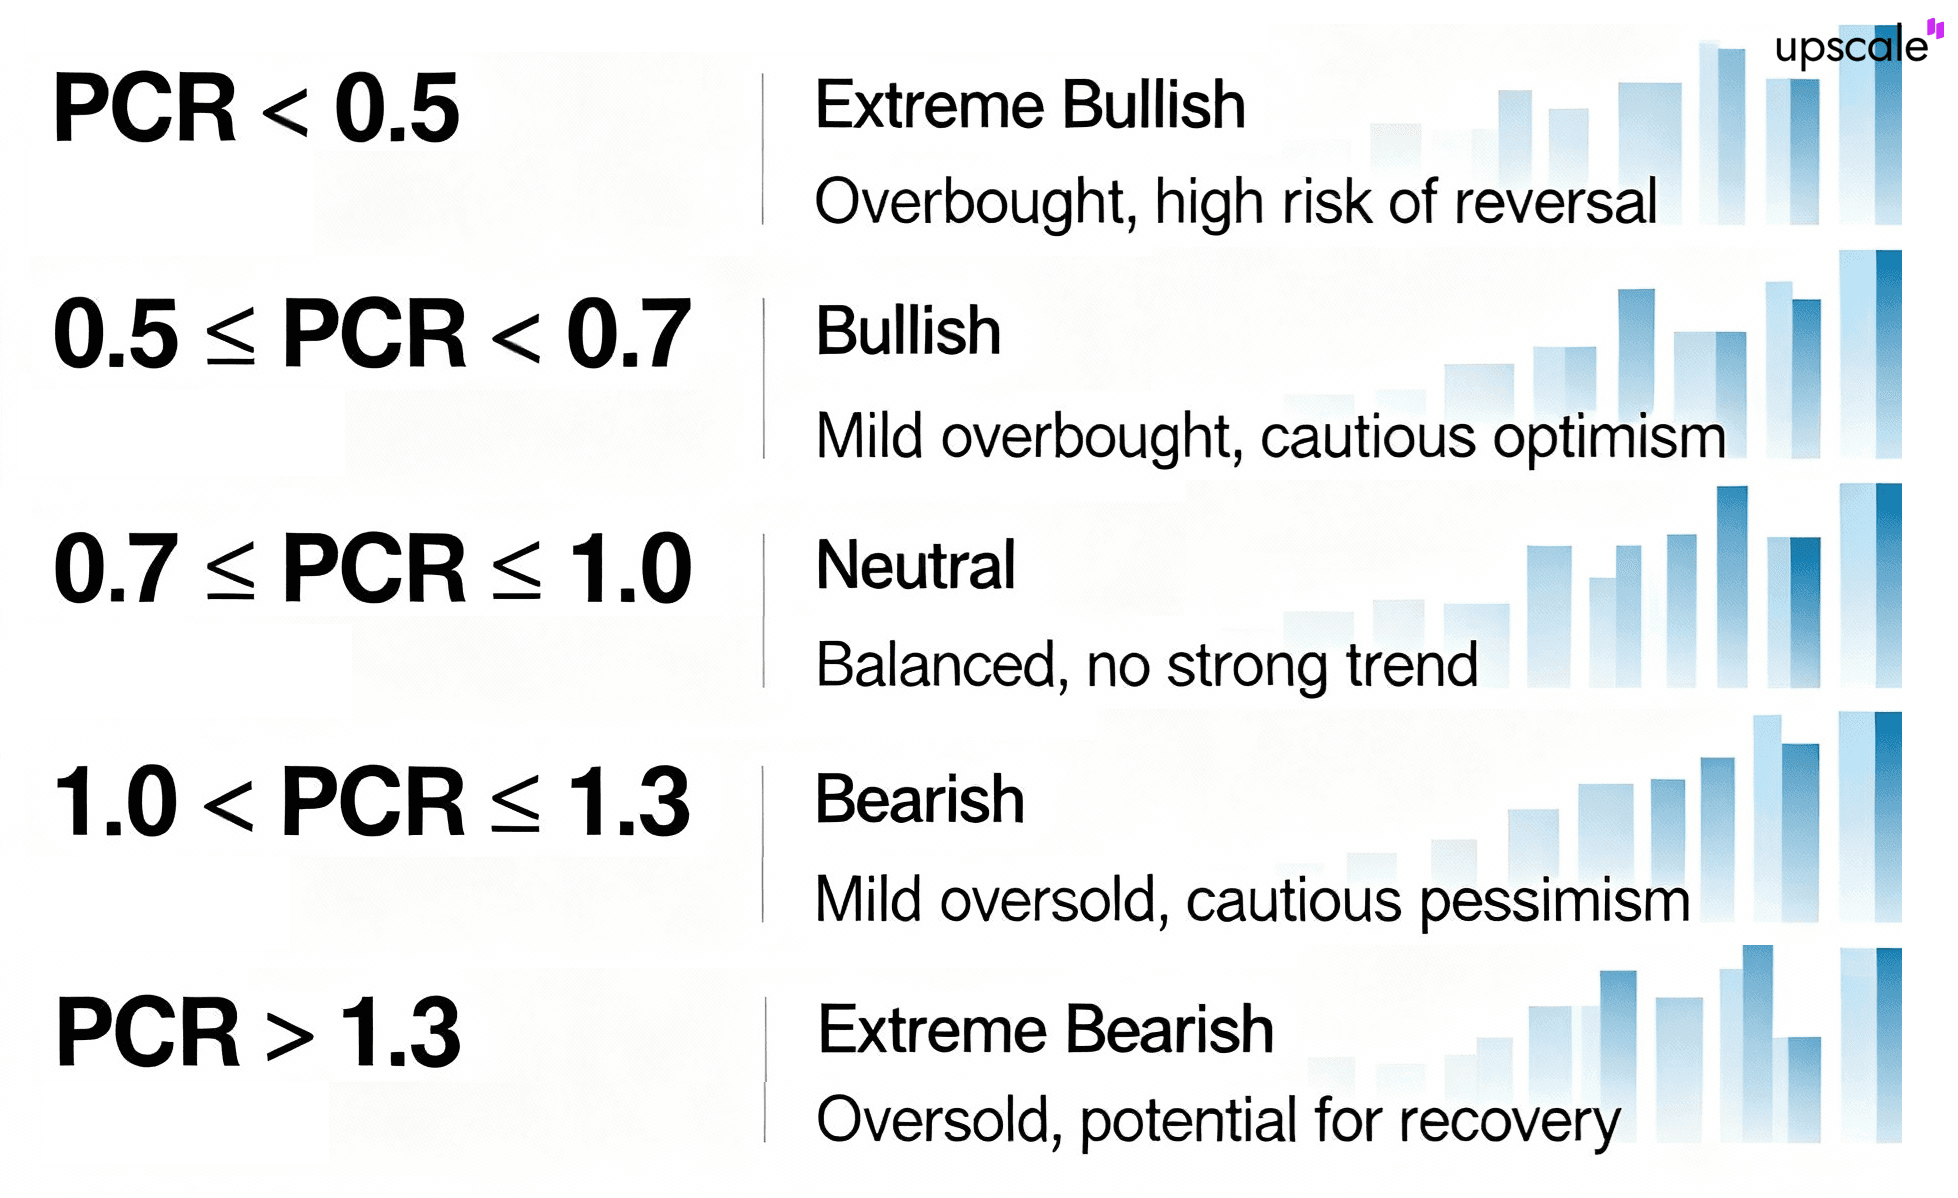
Market psychology drives put call ratio fluctuations throughout trading sessions. Higher put volume relative to call volume creates PCR values above 1.0, indicating bearish sentiment dominance. Lower put activity versus calls produces readings below 0.7, suggesting bullish positioning.
PCR functions as a contrarian indicator at extreme levels. When everyone expects market declines, selling pressure often exhausts itself. Conversely, excessive optimism frequently precedes corrections.
Simple PCR interpretation framework helps beginning traders. PCR above 1.2 signals potential buying opportunities. PCR below 0.5 warns of possible market tops. Neutral readings between 0.7-0.8 suggest balanced conditions.
How to Calculate Put Call Ratio: Two Essential Methods
Understanding PCR calculation methods enables accurate market sentiment analysis. Two primary approaches exist for computing put call ratio values. Volume-based calculations capture daily trading activity patterns. Open interest methods reflect accumulated market positioning over time.
Each calculation method serves different analytical purposes and timeframes. Professional traders often monitor both approaches simultaneously. This provides a comprehensive view of market sentiment dynamics across various time horizons.
Data sources affect PCR accuracy and interpretation reliability. Major exchanges publish official PCR statistics daily. Independent data providers offer real-time PCR tracking. Cryptocurrency exchanges provide digital asset PCR data.
Put Call Ratio Formula Based on Open Interest
Open interest PCR calculation uses outstanding contracts rather than daily trading volume. This method provides more stable readings by filtering intraday noise.
Formula: PCR (OI) = Total Put Open Interest ÷ Total Call Open Interest
Open interest represents the total number of outstanding options contracts. These positions remain open until expiration or closing transactions occur. Changes happen only when new positions open or existing ones close.
Example calculation demonstrates open interest methodology:
-
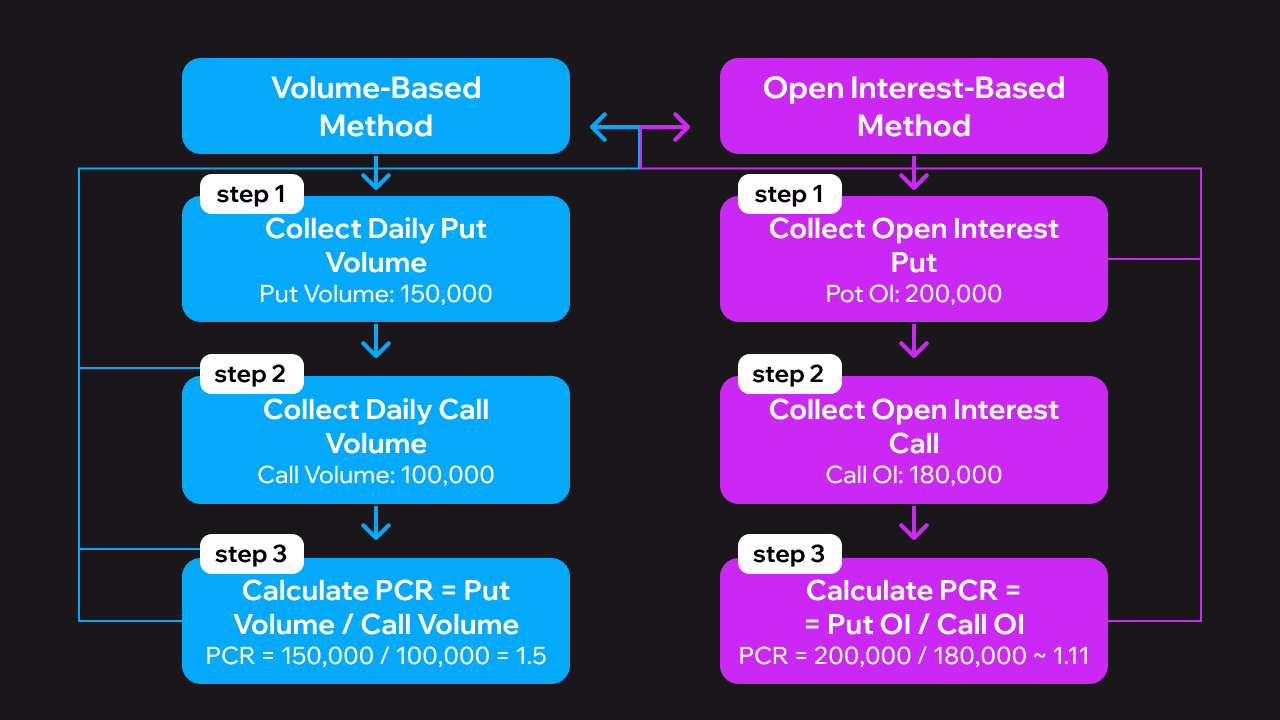
Put open interest: 850,000 contracts
-
Call open interest: 1,200,000 contracts
-
PCR (OI) = 850,000 ÷ 1,200,000 = 0.71
This reading indicates slightly bullish positioning. More call contracts remain outstanding than puts. Open interest PCR suits longer-term sentiment analysis effectively.
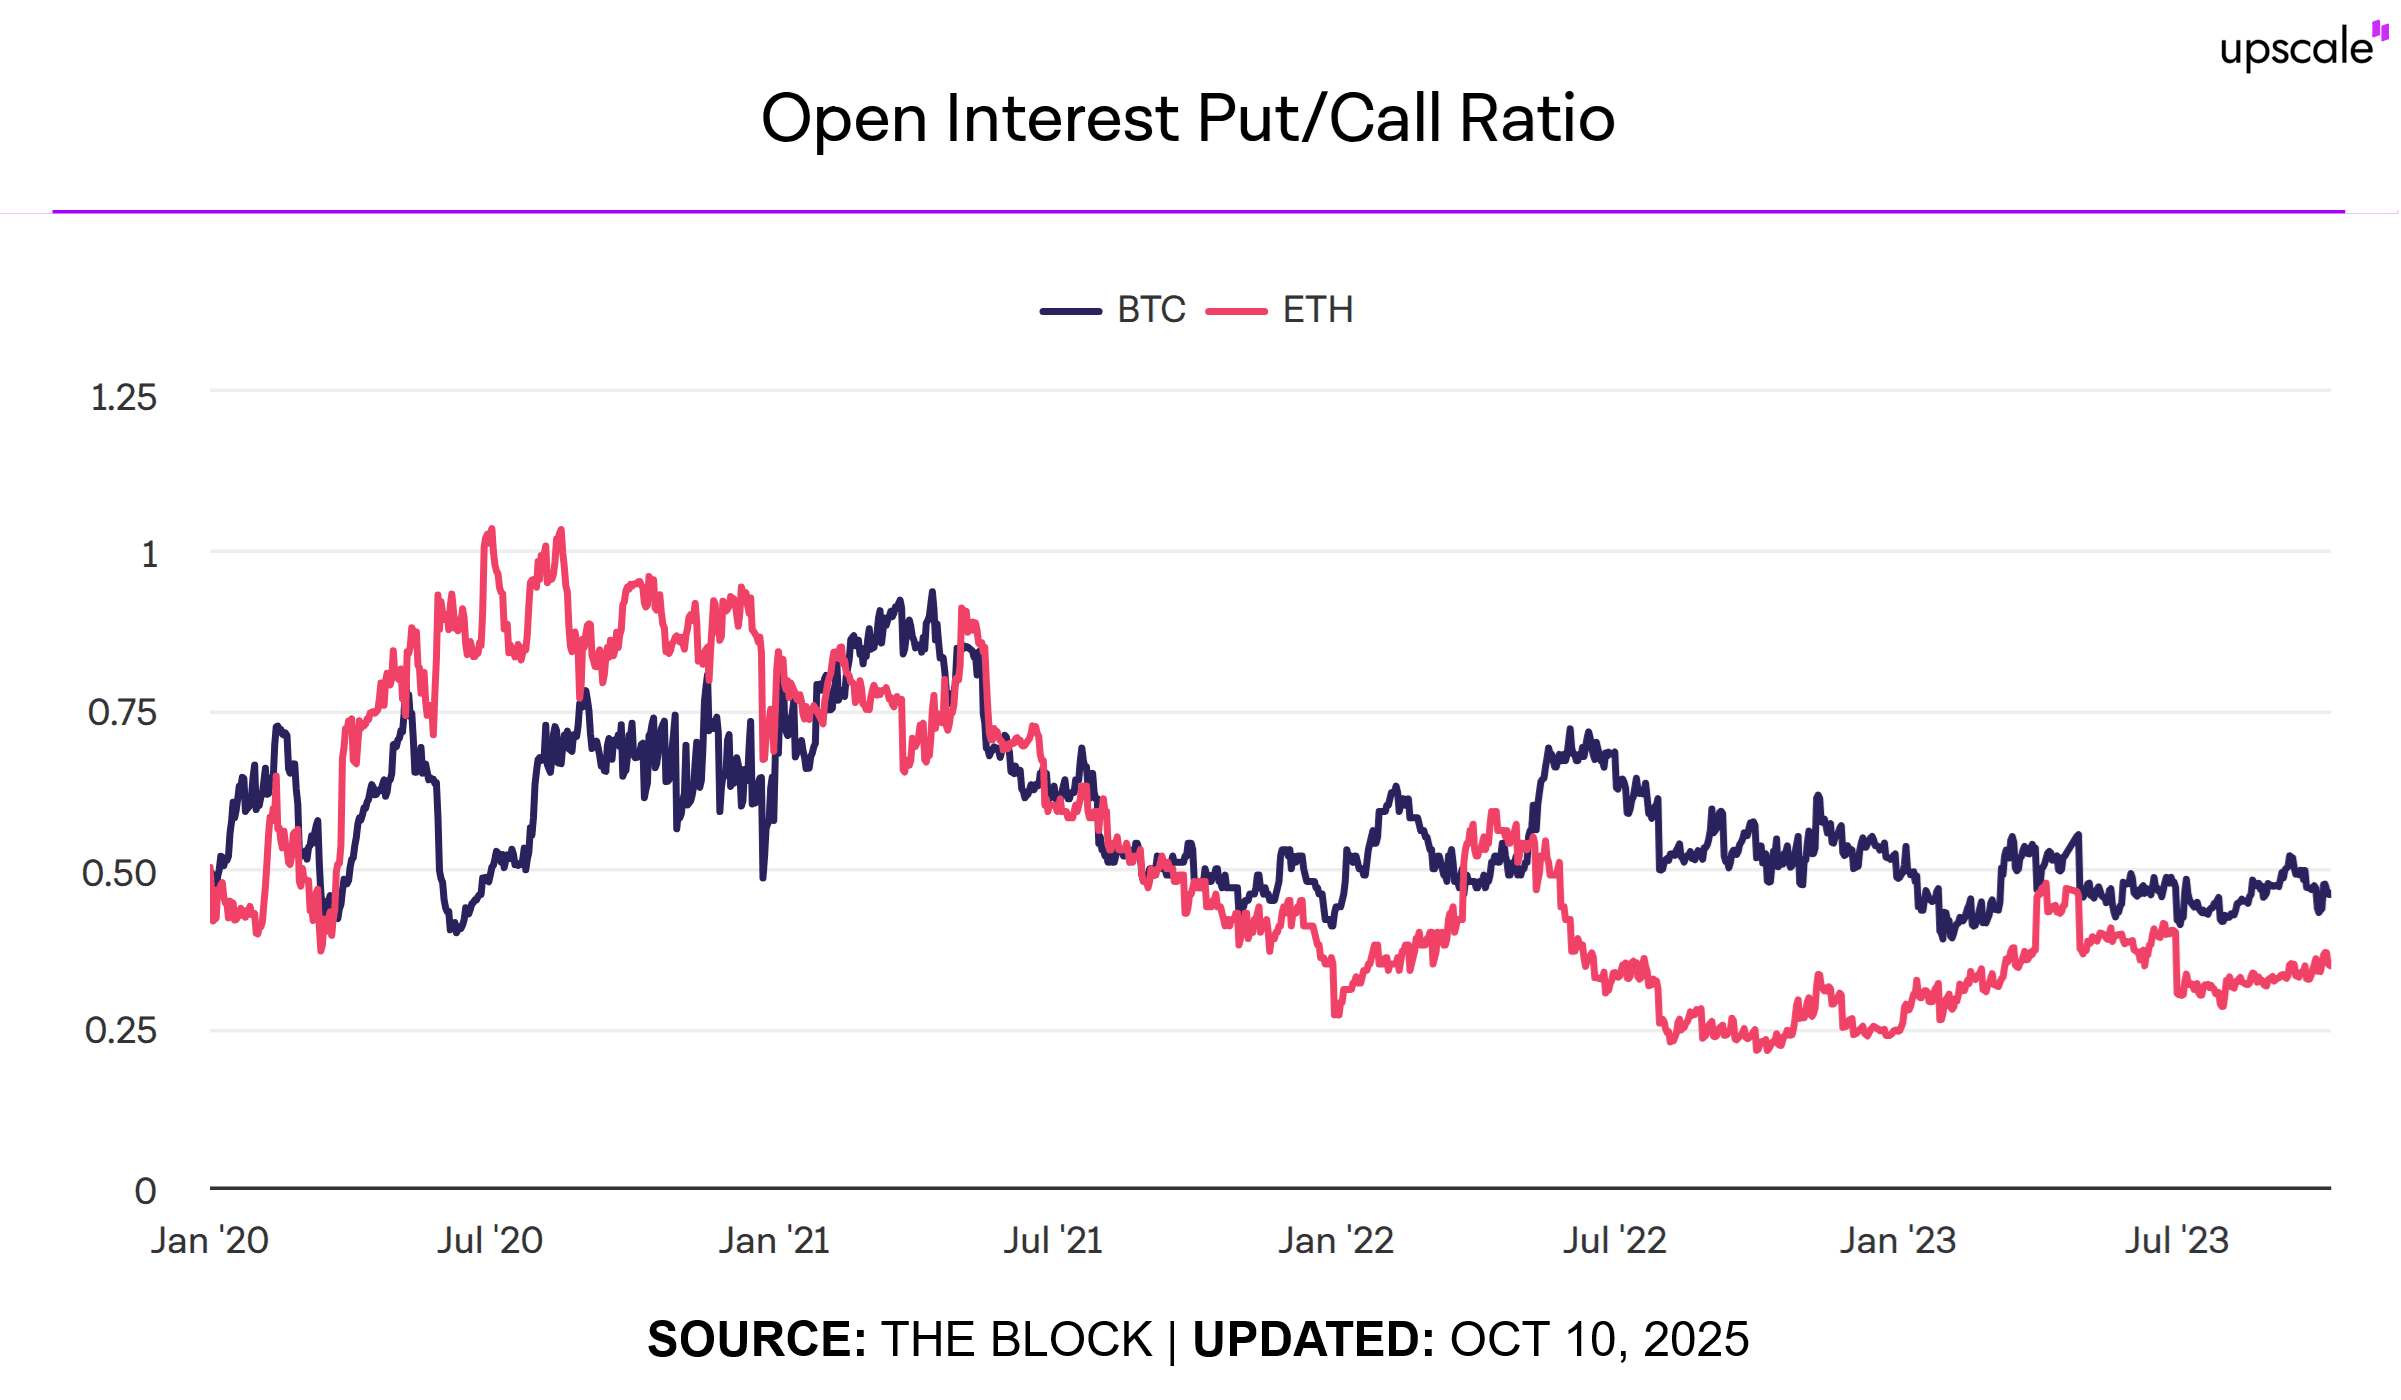
Within this context, the accompanying chart vividly illustrates how the open interest put/call ratio for both Bitcoin and Ethereum has fluctuated between 0.25 and 1.0 --- and beyond --- since January 2020, highlighting key sentiment extremes that often preceded major market reversals.
Put Call Ratio Formula Using Trading Volume
Volume-based PCR calculation responds quickly to intraday sentiment changes. Daily trading volume creates more sensitive PCR readings that capture immediate market reactions. Formula: PCR (Volume) = Total Put Volume ÷ Total Call Volume.
Trading volume represents actual contracts bought and sold during sessions. Volume updates continuously throughout trading hours. This creates real-time sentiment measurement capabilities.
Example volume calculation shows immediate sentiment:
-
Daily put volume: 2,400,000 contracts
-
Daily call volume: 3,100,000 contracts
-
PCR (Volume) = 2,400,000 ÷ 3,100,000 = 0.77
Near-neutral reading suggests balanced sentiment. Volume-based PCR works best for short-term trading decisions. Intraday traders prefer this calculation method.
Put Call Ratio Analysis: Interpreting the Values
Proper PCR interpretation requires understanding threshold levels and market context. Different PCR ranges signal varying degrees of bullish or bearish sentiment intensity. Professional traders use these thresholds to identify potential market turning points and sentiment extremes.
Market conditions affect PCR interpretation significantly. Bull markets typically show lower baseline PCR values. Bear markets often maintain higher average readings. Volatility regimes influence normal PCR ranges across different assets.
Sector-specific PCR patterns require individual analysis approaches. Technology stocks show different normal ranges than utilities. Growth sectors typically exhibit lower PCR baselines than defensive sectors.
What Is a Normal Put Call Ratio?
Normal PCR ranges vary by asset class and market conditions but typically fall between 0.7 to 0.8 for broad market indices. Individual equity PCR often ranges 0.6-0.8 during neutral periods. Technology sector PCR runs lower at 0.5-0.7 reflecting growth orientation.
Index PCR readings differ from individual stock measurements. S&P 500 PCR normal range spans 0.8-1.0. NASDAQ PCR typically measures 0.6-0.9. Russell 2000 small-cap PCR shows 0.7-0.9 baseline.
Market environment shapes normal PCR boundaries significantly. Bull market periods reduce average PCR levels. Bear market phases elevate typical readings. Transitional periods create wider normal ranges.
Different Time Frames for PCR Analysis
PCR analysis effectiveness depends on matching timeframes to trading objectives. Daily PCR suits short-term trading decisions with 1-5 day holding periods. Weekly PCR helps swing traders identify multi-day opportunities. Monthly PCR guides position traders making longer-term commitments.
Intraday PCR fluctuations provide immediate sentiment snapshots. These readings respond quickly to news events and market developments. Short-term traders monitor hourly PCR changes during volatile sessions.
Multiple timeframe analysis improves PCR signal quality. Daily extremes gain significance when weekly PCR confirms. Monthly trends provide context for shorter-term signals. Conflicting timeframe signals suggest market uncertainty.
Real-World Examples: Put Call Ratio in Action
Historical market events demonstrate PCR's predictive capabilities across different scenarios. Major market crashes consistently show distinct PCR patterns before and during price declines. Market bottoms frequently coincide with extreme PCR spikes above 1.5 as panic selling exhausts bearish positioning.
Case studies from equity and cryptocurrency markets validate PCR effectiveness. March 2020 COVID crash showed PCR reaching 1.65 at market bottom. 2008 financial crisis produced similar extreme readings during capitulation phases.
Professional traders use these historical patterns to identify current opportunities. PCR extreme readings create high-probability reversal setups. Risk management becomes crucial when acting on contrarian PCR signals.
Market Crash Warning Signs in PCR
Market crashes often follow predictable PCR progression patterns. Initial complacency shows PCR declining to extreme lows below 0.5, indicating excessive bullish positioning vulnerable to liquidation. Subsequent crash phases produce rapid PCR spikes above 1.3.
October 2008 demonstrated classic crash PCR behavior. September PCR dropped to 0.48 before Lehman Brothers collapse. Crash week saw PCR spike to 1.56 as panic hedging dominated.
March 2020 COVID crash followed similar patterns. February PCR registered 0.52 before selling began. March 23 market bottom coincided with PCR reaching 1.65. Recovery started within days of extreme reading.
Cryptocurrency market crashes show more extreme PCR readings:
-
May 2021 Bitcoin crash: PCR at 0.41 at $64K top, spiked to 1.28 at
-
November 2022 FTX collapse: Bitcoin PCR reached 1.38 during panic
-
Terra/LUNA May 2022: Crypto PCR surged to 1.45 during systemic fear
Identifying Market Bottoms with PCR
Extremely high PCR readings often mark market bottoms and buying opportunities. PCR spikes above 1.4 indicate oversold conditions where selling pressure typically exhausts within 2-3 weeks. These extreme bearish readings create contrarian buy signals.
Bottom identification methodology requires multiple confirmations. PCR extreme reading provides the initial signal. Technical oversold conditions add confirmation. Volume climax patterns validate selling exhaustion.
Historical bottom analysis shows consistent patterns:
-
March 2009: PCR peaked at 1.58 marking major bottom
-
December 2018: PCR reached 1.52 before significant rally
-
March 2020: PCR hit 1.65 at pandemic bottom
Cryptocurrency bottom signals follow similar patterns:
-
December 2022 Bitcoin $15.5K bottom: Deribit PCR reached 1.42
-
June 2022 Terra aftermath: Bitcoin PCR spiked to 1.48 at $17.5K
-
March 2020 crypto crash: Bitcoin PCR exceeded 1.35 at $3.8K
PCR Analysis in Cryptocurrency Options Markets
Cryptocurrency options markets provide unique PCR analysis opportunities. Bitcoin and Ethereum options dominate digital asset derivatives volume. Deribit exchange controls 80-85% of crypto options trading activity.
Crypto PCR characteristics differ from traditional markets significantly. 24/7 trading creates continuous data without session gaps. Higher leverage amplifies sentiment extremes. Retail participation creates different dynamics than institutional-dominated equity options.
Professional crypto prop trading firms utilize PCR extensively for risk management. Upscale, recognized among leading cryptocurrency prop trading platforms, demonstrates how PCR analysis provides 3-7 day advance signals for directional shifts in volatile digital asset markets.
Crypto-specific PCR thresholds require adjustment from equity levels. Neutral range spans 0.6-0.9 versus equity 0.7-0.8. Extreme bullish readings below 0.4. Extreme bearish above 1.4. These differences reflect unique market participant behavior.
Using Put Call Ratio in Your Trading Strategy
Systematic PCR integration improves trading decision quality across multiple timeframes. Successful implementation requires establishing clear entry and exit criteria based on PCR readings. Professional traders combine PCR signals with technical confirmation for higher probability trade setups.
Risk management becomes essential when trading PCR signals. Position sizing should reflect signal strength and market volatility. Stop-loss placement protects against false signals. Profit targets utilize technical resistance levels rather than PCR changes.
Trading rules framework provides a systematic approach. Identify PCR extreme reading. Confirm with price action analysis. Verify using complementary indicators. Enter with defined risk parameters. Manage positions through technical levels.
Put Call Ratio as a Contrarian Indicator
PCR functions as a contrarian indicator because extreme readings indicate positioning exhaustion rather than trend continuation. When PCR exceeds 1.3, excessive bearish positioning suggests limited selling pressure remains. Conversely, PCR below 0.5 indicates extreme bullish positioning with minimal buying power left.
Contrarian effectiveness emerges through behavioral finance principles. Extreme sentiment readings typically coincide with market inflection points. Positioning exhaustion creates conditions for reversal rather than continuation.
Statistical analysis supports contrarian interpretation. When PCR reaches extremes above 1.5 or below 0.4, market reversals occur within 5-10 trading sessions approximately 65-70% of historical cases.
Combining PCR With Other Technical Indicators
PCR reliability improves significantly when combined with complementary technical indicators for signal confirmation. RSI provides momentum validation when showing divergence at PCR extremes. Moving averages offer trend context for PCR reversal signals.
Volume analysis confirms PCR signal strength. High volume during PCR extremes increases reversal probability. Low volume extremes often produce false signals. MACD crossovers provide precise entry timing after PCR setup.
Cryptocurrency traders enhance PCR analysis with funding rates and on-chain metrics. Extreme negative funding rates combined with high PCR often signal bottoms. Exchange flow data validates PCR-indicated sentiment extremes.
Limitations of Put Call Ratio You Should Know
PCR analysis contains inherent limitations requiring recognition and mitigation strategies. Institutional hedging activity can distort PCR readings by creating put buying unrelated to bearish speculation. Portfolio insurance and risk management create false sentiment signals.
Options expiration effects distort PCR measurements predictably. Volume patterns shift due to position rolling rather than sentiment changes. Low volume periods produce unstable PCR calculations. Single-stock events create misleading market-wide readings.
Market structure evolution affects PCR interpretation over time. Algorithmic trading influences volume patterns. Options market-making activities create artificial volume. Cross-market hedging introduces complexity to traditional analysis frameworks.
When PCR Is Less Reliable
Options expiration weeks reduce PCR signal quality significantly. Monthly and quarterly expiration periods create volume patterns unrelated to directional sentiment. Avoid PCR-based decisions during major expiration events.
Extreme market volatility periods distort normal PCR relationships. VIX above 40 creates panic hedging that skews typical sentiment patterns. Economic announcement anticipation generates positioning unrelated to trend expectations.
Low reliability scenarios include:
-
Major options expiration weeks
-
Extremely low volume trading days
-
Single-stock dominated option volume
-
Major economic releases within 24 hours
-
Post-earnings season unusual patterns
Monitoring Today's Put Call Ratio: Tools and Resources
Real-time PCR monitoring requires access to reliable data sources from established financial information providers. CBOE publishes official equity PCR data daily. Bloomberg Terminal provides institutional-grade real-time PCR analytics. Free resources include Yahoo Finance and MarketWatch for basic PCR information.
Cryptocurrency PCR data requires specialized sources. Deribit Statistics page offers free Bitcoin and Ethereum PCR data. Laevitas.ch provides comprehensive crypto options analytics. CME Group publishes institutional Bitcoin options PCR daily.
Premium platforms offer advanced PCR analysis capabilities. FactSet provides historical PCR databases. TradingView includes PCR indicators with charting tools. Professional traders often subscribe to multiple sources for comprehensive coverage.
Put Call Ratio and the VIX: Understanding the Relationship
PCR and VIX complement each other as sentiment indicators measuring different market aspects. VIX measures forward-looking volatility expectations while PCR captures actual trading activity sentiment. Both indicators published by CBOE enable synchronized analysis approaches.
Correlation patterns between PCR and VIX provide enhanced market insight. Positive correlation during stress periods confirms sentiment extremes. Divergence signals suggest volatility demand without directional conviction. Combined interpretation improves signal reliability significantly.
Statistical relationships show moderate positive correlation of approximately +0.45 during normal periods. Correlation increases to +0.65 during market stress when VIX exceeds 25. Combined thresholds create powerful sentiment frameworks for reversal identification.
Building Your PCR Analysis System
Successful PCR implementation requires systematic approach development and consistent application methodology. Mastering PCR analysis involves establishing specific thresholds, requiring multi-indicator confirmation, and maintaining disciplined risk management throughout all market conditions.
Integration framework includes PCR as the primary sentiment filter followed by technical confirmation and risk-reward assessment. Position sizing should reflect signal strength and market volatility levels. Stop-loss placement protects against false signals and unexpected developments.
Professional traders continuously refine PCR strategies based on market structure evolution and performance feedback. Backtesting validates approach effectiveness across multiple market cycles. Documentation ensures consistent application and continuous improvement opportunities.
Visit Upscale.trade for professional trading infrastructure incorporating advanced PCR analysis alongside comprehensive cryptocurrency trading tools and funded account opportunities.
FAQ
What is the put call ratio and how does it work?
Put call ratio measures market sentiment by comparing put options volume to call options volume traded daily. Higher ratios indicate bearish sentiment while lower ratios suggest bullish positioning. PCR works as a contrarian indicator at extreme levels.
How is the put call ratio calculated?
PCR calculation uses two methods: volume-based (daily put volume ÷ daily call volume) or open interest-based (total put contracts ÷ total call contracts). Volume method provides real-time sensitivity while open interest offers stable longer-term readings.
What does a put call ratio above 1 indicate?
Put call ratio above 1.0 indicates bearish sentiment dominance with more put volume than call volume. Readings above 1.2 suggest potential buying opportunities as a contrarian indicator. Extreme readings above 1.5 often mark market bottoms.
How can traders use the put call ratio to make investment decisions?
Traders use PCR extremes as reversal signals combined with technical confirmation. PCR above 1.3 suggests oversold conditions suitable for long positions while PCR below 0.5 warns of potential corrections. Always combine with risk management.
What is considered a normal or neutral put call ratio?
Normal PCR ranges between 0.7-0.8 for broad market indices during balanced sentiment periods. Individual stocks typically show 0.6-0.8 neutral ranges. Technology sectors often display lower baselines while defensive sectors run higher averages.
