Mastering Fair Value Gap Trading: High-Probability Price Zones Explained

Mastering Fair Value Gap Trading: High-Probability Price Zones Explained
Every trader dreams of finding where institutional money moves. Fair value gaps reveal exactly that. These price inefficiencies act like footprints left by big players.
A fair value gap represents an unfilled price zone on your chart. It forms when price moves so fast that normal trading cannot occur. Think of it as a building elevator skipping several floors. Those missed floors wait to be visited later.
Smart Money Concepts framework positions FVGs as powerful tools. They show where institutions entered aggressively. The market remembers these zones. Price returns to them with 70-85% probability.
Why does this matter for you? Because FVGs provide specific entry points. No guessing. No vague support levels. Just clear zones where institutional order flow created imbalance.
When you understand fair value gaps, you stop fighting institutions. You start following them. This guide teaches you exactly how to identify, trade, and profit from these high-probability price zones.
What is a Fair Value Gap in Trading?
Fair value gaps are unfilled price zones on charts. They appear when price moves too rapidly for normal trading activity. The market literally skips certain price levels.
Here is how to spot one. Look for three consecutive candles. The middle candle creates a gap. Its wick does not overlap with the wicks of candles before and after it. This visual pattern appears on any chart.
The formation cause is simple: buyer-seller imbalance. Aggressive institutional orders overwhelm available liquidity. Price jumps to the next liquidity zone. A gap remains behind.
These zones act as magnets. Price frequently returns to fill them. Statistics show 70-85% of FVGs eventually get filled. The market seeks efficiency. Unfilled levels represent inefficiency that must be corrected.
FVGs connect directly to Smart Money Concepts. They represent institutional footprints. When banks or hedge funds move large positions, they leave traces. FVGs are those traces.
Imagine a crowded highway. Everyone suddenly rushes to one exit. Some stretches of road remain empty. Later, traffic flows back to fill those empty sections. FVGs work the same way in markets.
The Market Psychology Behind Fair Value Gaps
Large institutional orders create fair value gaps through aggressive execution. Banks, hedge funds, and algorithmic systems need to move significant positions quickly. They consume all available orders at certain prices.
When institutions buy or sell urgently, they overwhelm liquidity. Price jumps to the next available level. The gap left behind shows where their activity was too aggressive for normal market flow.
Why does price return? Markets seek equilibrium. Unfilled price levels represent inefficiency. Normal price discovery did not occur there. Later participants recognize these zones as institutionally significant.
Technical traders worldwide identify the same FVGs. They place orders near these zones. This creates a self-fulfilling prophecy. More attention means higher probability of price returning.
The result? FVGs act as magnets with 70-85% fill rates. The market rebalances the inefficiency created by institutional urgency.
What Causes Fair Value Gaps in Trading?
Four main catalysts create fair value gaps in trading. Understanding them helps you anticipate new formations.
Institutional order flow is the primary cause. Large players execute significant orders that overwhelm available liquidity. They consume all orders at certain prices. Price skips to the next liquidity zone.
High-impact news events trigger immediate reactions. Fed decisions, employment data, and inflation reports cause rapid price movement. Everyone rushes to the same side. Gaps form as price jumps through levels.
Earnings reports create information asymmetry. Institutions react immediately. Retail traders process information more slowly. This one-sided pressure generates gaps during the delay.
Extreme market sentiment shifts cause herd behavior. Geopolitical events or market crashes evaporate liquidity on one side. Price gaps as it seeks available counterparties.
Note that FVGs relate to supply and demand zones conceptually. However, they differ in precision. FVGs are specific gaps between candles. Supply and demand zones cover broader price areas.
How to Identify Fair Value Gaps on Your Charts
The three consecutive candles rule defines valid FVG identification. Look for three candles where the middle one creates an unfilled gap. The gap should not overlap with surrounding candles.
Follow this step-by-step identification process. First, scan for three consecutive candles moving in the same direction. Second, check if the middle candle created a gap. For bullish FVGs, measure from the high of the first candle to the low of the third. For bearish FVGs, measure from the low of the first candle to the high of the third.
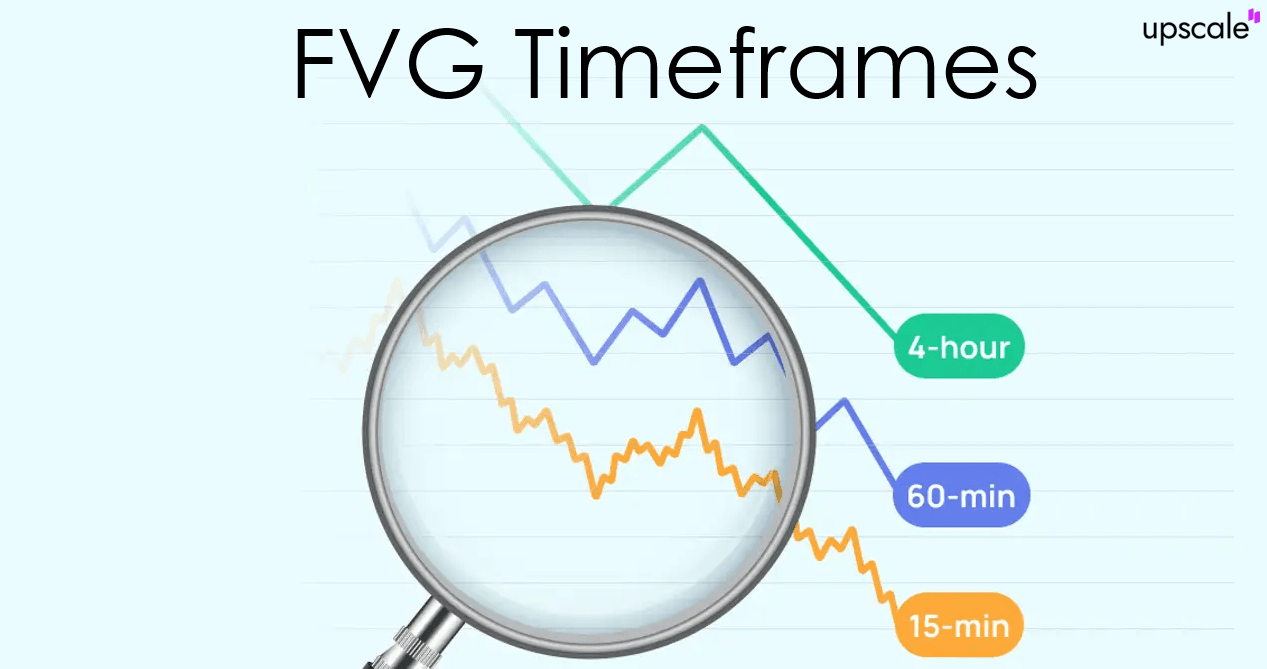
Third, verify that wicks do not overlap. Fourth, measure the gap size. Minimum thresholds vary by instrument. Forex typically requires 10+ pips. Crypto needs 0.2%+ gap size. Fifth, assess market context including higher timeframe direction and recent structure.
Not all gaps deserve your attention. Significant FVGs occur on higher timeframes like 4H and above. They align with higher timeframe trends. They form near key structure levels. They show substantial size relative to average candle range.
Insignificant FVGs appear during choppy price action. They lack directional context. They represent tiny gaps relative to normal volatility. Skip these and focus on quality setups.
Bullish vs. Bearish Fair Value Gap Examples
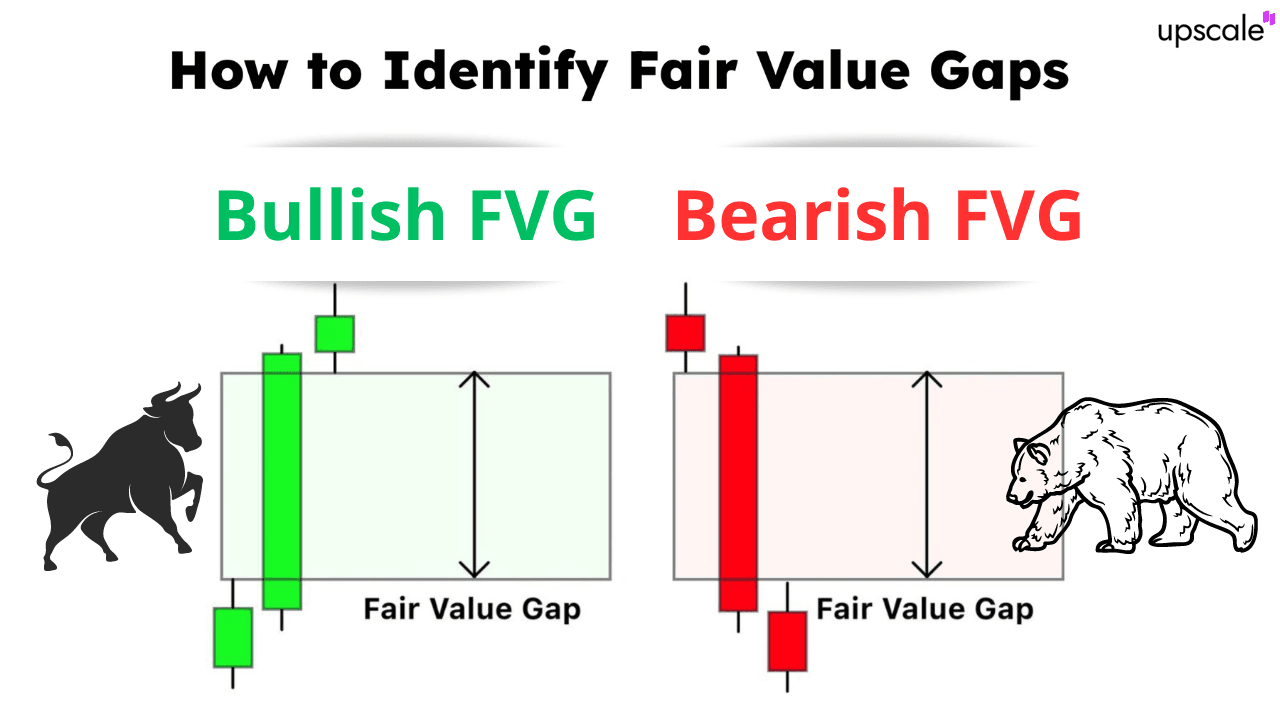 Bullish fair value gaps form during upward price movement. The pattern shows a down candle or consolidation first. An aggressive up candle follows, gapping higher. A continuation candle maintains position above the gap.
The visual result shows unfilled space below current price. This zone represents a long entry opportunity. Price may return here before continuing higher. Target the return to the low of the first candle as minimum expectation. Success rate reaches approximately 75% under proper conditions.
Bearish fair value gaps form during downward movement. An up candle or consolidation comes first. An aggressive down candle follows, gapping lower. A continuation candle does not fill the gap upward.
The visual result shows unfilled space above current price. This zone offers a short entry opportunity. Price may return before continuing lower. Target the high of the first candle. Success rate similarly reaches around 75%.
Both types have comparable reliability. The difference is directional bias. Your selection depends on higher timeframe market structure and your directional bias.
Fair Value Gaps vs. Other Market Inefficiencies
Fair value gaps differ from other market concepts. Understanding distinctions prevents misidentification.
Order blocks represent specific candles where institutions entered. They are the last opposing candle before significant directional moves. FVGs are the unfilled spaces created during the move itself. Order blocks are solid price zones. FVGs are empty price zones.
The relationship matters for trading. Order blocks frequently precede FVGs. Use both together for higher-probability setups. Order blocks show where smart money positioned. FVGs show the inefficiency from their execution.
Regular price gaps differ from FVGs. Regular gaps occur between trading sessions. Think overnight or weekend gaps in stocks. FVGs occur during active trading from rapid intra-session movement. FVGs have higher statistical fill probability at 70-85%.
Supply and demand zones are broader price areas. They span multiple price levels and are less precise. FVGs are specific gaps between consecutive candles. They offer precise, measurable zones. Both reflect imbalances but differ in precision and identification methodology.
Inverse Fair Value Gap Explained
Inverse fair value gaps signal potential reversals. They form at market extremes after extended moves. Price becomes overextended, then reverses immediately.
Standard FVGs suggest continuation or mitigation zones. IFVGs behave differently. They form during the final exhaustion push. Price creates a gap, then immediately reverses through it. This inverts the expected behavior.
Look for IFVGs at obvious extremes. Multi-week highs or lows qualify. Psychological levels and major resistance or support work too. Volume spikes and volatility expansion indicate climactic behavior.
When price immediately rejects its own gap, the previous trend has exhausted. Reversal is underway. IFVG reliability approaches 80-85% due to formation context at significant turning points.
Fair Value Gaps in Different Markets
Fair value gaps manifest across all financial markets. However, market-specific characteristics affect their behavior.
Forex markets show clean FVG formation due to deep liquidity. Major pairs like EUR/USD and GBP/USD work best. Gaps tend to be smaller at 5-20 pips but precise. Best timeframes range from 15-minute to 4-hour charts. Fill rate reaches approximately 75-80% during London and New York sessions.
Cryptocurrency markets display highly visible FVGs due to 24/7 trading and higher volatility. Use 1-hour to daily charts. Lower timeframes can be noisy. Fill rate reaches approximately 70-75%. Larger gaps are common at 0.5-2% for BTC/USDT. Continuous trading means all gaps are true FVGs formed during session.
Stock markets require focus on liquid stocks with high daily volume. Daily to weekly charts generally prove most reliable. Fill rate ranges from 70-80% depending on stock liquidity. Distinguish true intraday FVGs from overnight gaps.
Despite market differences, identification methodology remains identical. Three candles with unfilled gap. Adapt expectations for volatility characteristics of each market.
Fair Value Gap Trading Strategy
A complete FVG trading strategy includes identification, confirmation, entry, stop loss, take profit, and position sizing.
The identification phase locates valid FVGs using the three-candle pattern. Start with 4H or daily charts for clarity. Verify the gap meets minimum size requirements. Confirm it appears in context of higher timeframe trend direction.
Before entry, confirm additional factors. Higher timeframe alignment means FVG direction matches daily or weekly trend. Market structure support shows recent break of structure in FVG direction. Volume context confirms the initial gap formed on above-average volume. Clean price action means no major resistance or support within the FVG zone.
Entry execution offers two approaches. Aggressive entry places a limit order within the FVG zone immediately after formation. This captures best price if gap fills but may not fill if price continues. Conservative entry waits for price to return and show reaction before entering. Confirmation signals include rejection candles, volume increase, or smaller timeframe break of structure.
Stop loss placement goes beyond the FVG zone with a volatility buffer. For bullish FVGs, place stops 5-10 pips below the gap zone. For bearish FVGs, place stops 5-10 pips above. This protects capital if the FVG fails to hold.
Take profit uses a multi-target approach. Target 1 at 50% position goes to the opposite side of the FVG zone. Target 2 at 30% position goes to the next market structure level. Target 3 at 20% position uses extended targets or trailing stops.
Position sizing risks 0.5-1% of account per trade maximum. Calculate position size based on stop distance. Account balance times risk percentage divided by stop loss distance equals maximum position size.
Executing FVG strategies effectively requires proper capital and professional tools. This is where Upscale brings together capital, AI, and precision execution in one prop trading platform.
Professional traders need more than knowledge. They need funded trading accounts with institutional-grade infrastructure. Upscale.trade provides exactly that. Transparent terms mean you know what to expect. Risk management infrastructure protects your capital.
The philosophy is simple: we succeed when you succeed. FVG trading in fast-moving crypto markets demands precision execution. Market structure analysis capabilities help identify high-probability setups. With proper backing, you can focus on strategy instead of capital limitations.
Entry and Exit Techniques Using Fair Value Gaps
Entry timing variations affect your results significantly. Choose your approach based on risk tolerance.
Immediate entry places a limit order in the FVG zone right after gap formation. Advantage: captures best price if gap fills. Risk: may not fill if price continues without returning. Best for traders willing to miss some setups for optimal entry when filled.
Confirmation entry waits for price to return and show reaction. Look for strong rejection candles from the zone, volume increases, or smaller timeframe break of structure. Advantage: higher probability as price already shows interest. Risk: may miss quick fills. Best for traders prioritizing higher win rate.
Exit strategies determine your profitability. Fixed targets use the opposite side of the FVG for minimum targets. This represents gap fill with 70-85% probability. Structure-based targets extend to previous swing highs or lows. Scaling takes partial exits at multiple targets. Trailing stops let winners run based on structure.
FVGs serve as price mitigation zones. Price returns to balance inefficiency before potentially continuing its directional move.
Risk Management When Trading Fair Value Gaps
The 70-85% fill rate means 15-30% of setups will fail. Risk management is non-negotiable.
Never risk more than 0.5-1% of total account equity per FVG trade. Calculate position size systematically. Account balance times risk percentage divided by stop loss distance equals maximum position size. Example: $50,000 account with 1% risk equals $500. With a 50-pip stop, maximum position is 10 micro lots.
Always place stops beyond the FVG zone. Never within it. The zone should hold as support or resistance. If it does not, the setup is invalid. Typical stop placement is 5-15 pips beyond gap boundaries depending on volatility. Never move stops further away if price approaches. Accept the loss.
Minimum 1:2 risk-reward ratio is recommended. With 70-85% success rate and 1:2 R:R, mathematical expectancy stays strongly positive. Risk $500 to make $1,000+ creates favorable probability-based edge over time.
FVGs appear frequently. Resist temptation to trade every one. Quality over quantity. Often 2-3 high-quality FVG trades weekly outperform 20-30 lower-quality setups.
Multi-Timeframe Analysis for Fair Value Gaps
Multi-timeframe alignment dramatically improves FVG trading success rates.
 Start with higher timeframes like daily or 4H for direction and major FVGs. Identify overall market trend direction. Find significant FVG zones that institutions likely respect. Note major market structure levels. Only trade FVGs aligned with this direction.
Drop to mid timeframes like 1H or 15M for confirmation and setup refinement. Confirm higher timeframe FVG zones are still unfilled. Identify more precise entry zones within larger FVGs. Look for break of structure toward the FVG. Watch for change of character indicating momentum shift.
Use lowest timeframes like 5M or 1M for entry timing. Execute precise entries when price returns to the FVG zone. Refine stop losses with tighter placement. Spot early exit signals if price action shows rejection.
Break of Structure confirms momentum shift on mid and lower timeframes. Look for BOS in the direction of the FVG before entering. Change of Character on lower timeframes signals that price may return to the FVG zone.
Never trade an FVG on lower timeframes that conflicts with higher timeframe direction. If daily trend is bearish, only trade bearish FVGs on lower timeframes. Ignore bullish FVGs as counter-trend trades. Timeframe alignment often pushes fill rates toward 80-85%.
Real Trading Examples with Fair Value Gaps
Real examples demonstrate how theory becomes practice.
Example 1: Bullish FVG in Trending Market (BTC/USDT)
Market context showed Bitcoin in established uptrend on daily chart with higher highs and higher lows. On the 4H chart, aggressive buying created a bullish FVG between $42,800-$43,200.
Identification showed a clear three-candle pattern. A down candle reached $42,500. An aggressive up candle hit $44,000, creating the gap. A continuation candle maintained position above $43,500.
Entry decision used conservative approach. Waited for price to retrace to the FVG zone. Entry at $43,100 when 1H chart showed rejection candle with volume increase.
Stop placement went below the FVG zone at $42,650 for roughly 1% position risk. First target was $44,500 at recent structure high. Second target was $45,000 at the psychological level.
Outcome: Price reacted immediately from the FVG zone. First target hit within 8 hours. Closed 60% position at $44,500. Moved stop to breakeven. Remaining 40% hit second target. Total weighted gain: 1.4% on full position.
Example 2: Bearish FVG in Reversal Context (EUR/USD)
EUR/USD approached weekly resistance at 1.1000 after extended rally. On the 1H chart, price created a bearish FVG after rejection at resistance.
Aggressive entry placed a limit sell order at 1.0950 expecting price return. Stop placement above FVG zone at 1.0995 for a 45-pip stop. First target at 1.0850 offered approximately 1:2 R:R.
Outcome: Price returned to the gap zone within 6 hours. Filled entry at 1.0950. Then rallied through stop at 1.0995 for full loss. FVG did not hold.
Lesson: The daily chart was still bullish, creating conflict. Counter-trend setups fail more often regardless of FVG quality.
Fair Value Gap Examples Across Different Markets
Market-specific observations help set realistic expectations.
Formation similarity means FVG identification methodology is identical across all markets. Three-candle pattern with gap works everywhere. Size differences matter. Crypto gaps typically run larger at 0.5-2% due to higher volatility. Forex gaps stay smaller at 5-20 pips due to tighter spreads.
Fill rate variations exist. Forex major pairs show 75-80% fill rate due to deep liquidity. Crypto shows 70-75% due to occasional liquidity gaps. Timeframe preferences vary. Crypto works well on 1H-4H timeframes. Forex is optimal on 15M-4H. Stocks work best on daily or higher timeframes.
Execution considerations differ by market. Crypto allows 24/7 trading of FVGs. Forex is limited to session hours. Stocks trade only during market hours.
Common Mistakes to Avoid When Trading Fair Value Gaps
Six main mistakes derail FVG traders.
Trading every fair value gap without context ranks first. Once traders learn FVGs, they see them everywhere. Solution: Implement strict context filters. Only trade FVGs aligned with higher timeframe trend, near significant structure, during high-liquidity sessions, and meeting minimum size requirements.
Ignoring the 15-30% failure rate causes blown accounts. Solution: Accept that roughly 1 in 4-5 setups will lose. Use 0.5-1% risk per trade maximum. Do not abandon strategy after 3-4 consecutive losses.
Entering too early before confirmation stems from impatience. Solution: Wait for price to return and show reaction. Conservative entry produces better results for most traders.
Poor stop loss placement tries to maintain tight stops within FVG zones. Solution: Always place stops beyond the FVG zone with adequate buffer. Accept the loss if the zone does not hold.
Overtrading due to FVG abundance creates temptation to trade continuously. Solution: Set maximum daily or weekly trade limits. Focus on highest-probability setups only.
Trading FVGs in ranging markets ignores market regime. Solution: FVGs work best in trending markets. In choppy conditions, FVG reliability drops. Identify market regime first.
Algorithmic Trading with Fair Value Gaps
Manual scanning across multiple instruments becomes time-intensive. Algorithmic detection offers efficiency.
Automated systems enable simultaneous monitoring of dozens of instruments. They provide consistent identification without human bias. Immediate alerts notify when valid FVGs form. Systematic backtesting validates strategy effectiveness.
Key parameters for algorithmic detection include candle count set to 3 consecutive candles, gap size threshold as percentage of ATR typically at 0.5-1.0x, timeframe settings for 1H, 4H, and Daily, and overlap validation logic.
When backtesting FVG strategies algorithmically, use minimum 2-3 years of data history. Test across trending, ranging, and volatile conditions. Implement realistic execution assumptions including slippage and spread costs. Validate fill rate statistics align with expected 70-85% range.
TradingView offers community scripts for FVG detection. MT4 and MT5 support custom indicators. Algorithmic platforms like cTrader and NinjaTrader enable automated FVG strategies.
Important note: Algorithmic identification does not guarantee profitability. Proper strategy, risk management, and market context understanding remain essential.
Advanced Fair Value Gap Concepts
Fair value gaps do not occur randomly. They represent institutional footprints.
FVGs combined with liquidity pool analysis create high-probability setups. Common pattern: Price sweeps a liquidity pool, taking out obvious stops. Then price aggressively moves away creating an FVG. Eventually price returns to fill the gap. After observing liquidity grab, watch for FVG formation in opposite direction.
Order block plus FVG combinations increase reliability substantially. Order blocks are the last opposing candle before significant moves. When both align at the origin of a move, setup reliability increases. This layered approach often produces 80%+ success rates.
Market structure integration adds significance. Most powerful setups occur when FVG forms immediately after Break of Structure confirming momentum. FVGs appearing near significant swing highs or lows add structural significance. Multiple timeframe FVGs aligning at the same price zone create institutional confluence.
Price delivery algorithms from institutions create predictable patterns. FVGs represent inefficiencies these algorithms later clean up. Understanding this behavior improves anticipation of FVG fills.
Trading Psychology for Fair Value Gaps
Psychological challenges specific to FVG trading require attention.
 Patience is the most difficult psychological aspect. After identifying an FVG, price often continues away for extended periods. Temptation to chase or take poor entries emerges. Solution: Set limit orders and walk away. Missing some trades is better than losing capital on bad entries.
Acceptance of uncertainty matters. The 70-85% fill rate means 15-30% of setups will fail. Each trade feels binary. Solution: View FVG trading as a portfolio of bets. With proper risk management, you can withstand statistical failures while allowing winners to generate overall profitability.
Discipline under pressure tests traders when price approaches the FVG zone. Fear of missing entry, temptation to move entry price, and second-guessing emerge. Solution: Establish entry criteria before price approaches. If criteria are met, take the trade. If not, let it go.
Overcoming confirmation bias prevents seeing FVGs that do not meet criteria. Solution: Use an objective checklist for every potential FVG. If any answer is "no," skip the setup.
Advantages and Limitations of Fair Value Gap Trading
Honest assessment sets realistic expectations.
Advantages of FVG Trading
The 70-85% fill rate provides genuine statistical advantage when properly risk-managed. Visual clarity allows even beginners to identify FVGs with practice.
FVG zones provide natural stop loss placement areas. This creates clear risk definition. Universal applicability means the strategy works across forex, crypto, and stocks on multiple timeframes.
Automation potential allows coding into algorithms for systematic detection. Specific entry and exit points eliminate ambiguity compared to vague concepts. Integration with order blocks, liquidity analysis, and market structure enhances effectiveness.
Limitations of FVG Trading
The 15-30% failure rate is statistical reality. Roughly 1 in 4-5 setups will not work. This requires accepting losses.
Identification subjectivity means valid FVG definitions vary between traders. Minimum size debates continue. Market condition dependency means performance degrades in choppy, range-bound markets.
Patience requirements demand discipline. Temptation to overtrade runs high. Multi-timeframe analysis is necessary for best results. Single-timeframe FVG trading proves less reliable.
Avoid FVG trading during major scheduled news events, extremely low liquidity conditions, clearly ranging markets, and when higher timeframe market structure is unclear.
Conclusion: Implementing Fair Value Gaps in Your Trading
Fair value gaps represent genuine price inefficiencies with 70-85% probability of filling. Proper identification requires the three-candle pattern with unfilled gap between outer candles.
Multi-timeframe alignment dramatically improves success rates. Risk management is non-negotiable since 15-30% of setups will fail. Market context matters because FVGs work best in trending conditions.
Start by practicing identification on historical charts. Then paper trade until your fill rate matches expected 70-85%. Finally, implement with proper position sizing.
The knowledge you now have places you ahead of most retail traders. You understand where institutional money moves. You can identify the footprints they leave behind.
Now practice on a demo account. Mark FVGs on your charts. Track which ones fill. Build confidence through repetition. The edge is real. Your execution makes it profitable.
FAQ
What is a fair value gap in trading?
A fair value gap is an unfilled price zone on charts created when price moves so rapidly that normal trading activity cannot occur at certain price levels. It appears as a gap between three consecutive candlesticks where the middle candle creates space that does not overlap with the wicks of candles before and after it.
How do you identify a fair value gap?
Identify FVGs using the three-candle rule. Look for three consecutive candles moving in the same direction. Check if the middle candle created a gap where its wick does not overlap with the wicks of the first and third candles. Measure the gap size to ensure it meets minimum thresholds for your instrument.
How do you trade fair value gaps?
Trade FVGs by waiting for price to return to the gap zone. Use aggressive entry with limit orders placed immediately after formation. Or use conservative entry by waiting for price reaction at the zone. Place stop losses beyond the FVG zone. Target the opposite side of the gap as minimum profit objective.
What is an inverse fair value gap (IFVG)?
An inverse fair value gap forms at market extremes and signals reversal potential. Unlike standard FVGs that suggest continuation, IFVGs appear after extended moves when price creates a gap during final exhaustion push, then immediately reverses through that gap. They have higher reliability approaching 80-85%.
Do all fair value gaps get filled?
No, approximately 70-85% of fair value gaps eventually get filled. This means 15-30% of FVGs will never fill. Success depends on trading with proper context including higher timeframe alignment, market structure support, and quality setup selection. Risk management accounts for the setups that do not work.
