Best Scalping Trading Strategies for Quick Profits

Best Scalping Trading Strategies for Quick Profits
You already know what scalping is. Now you need proven strategies that actually work. This guide delivers eight complete methods with exact parameters — entry rules, exit criteria, indicator settings, and performance metrics. No theory. Just actionable approaches ready to implement. Professional scalpers maintain a strategy arsenal. They deploy specific methods matching current market conditions. That's what separates winners from strugglers. Let's explore the strategies that produce quick profits when executed correctly.
Strategy Selection Framework: Matching Methods to Market Conditions
No single strategy works universally. Markets shift between trending, ranging, volatile, and calm. Successful scalpers assess market character using quantifiable metrics before entering positions.
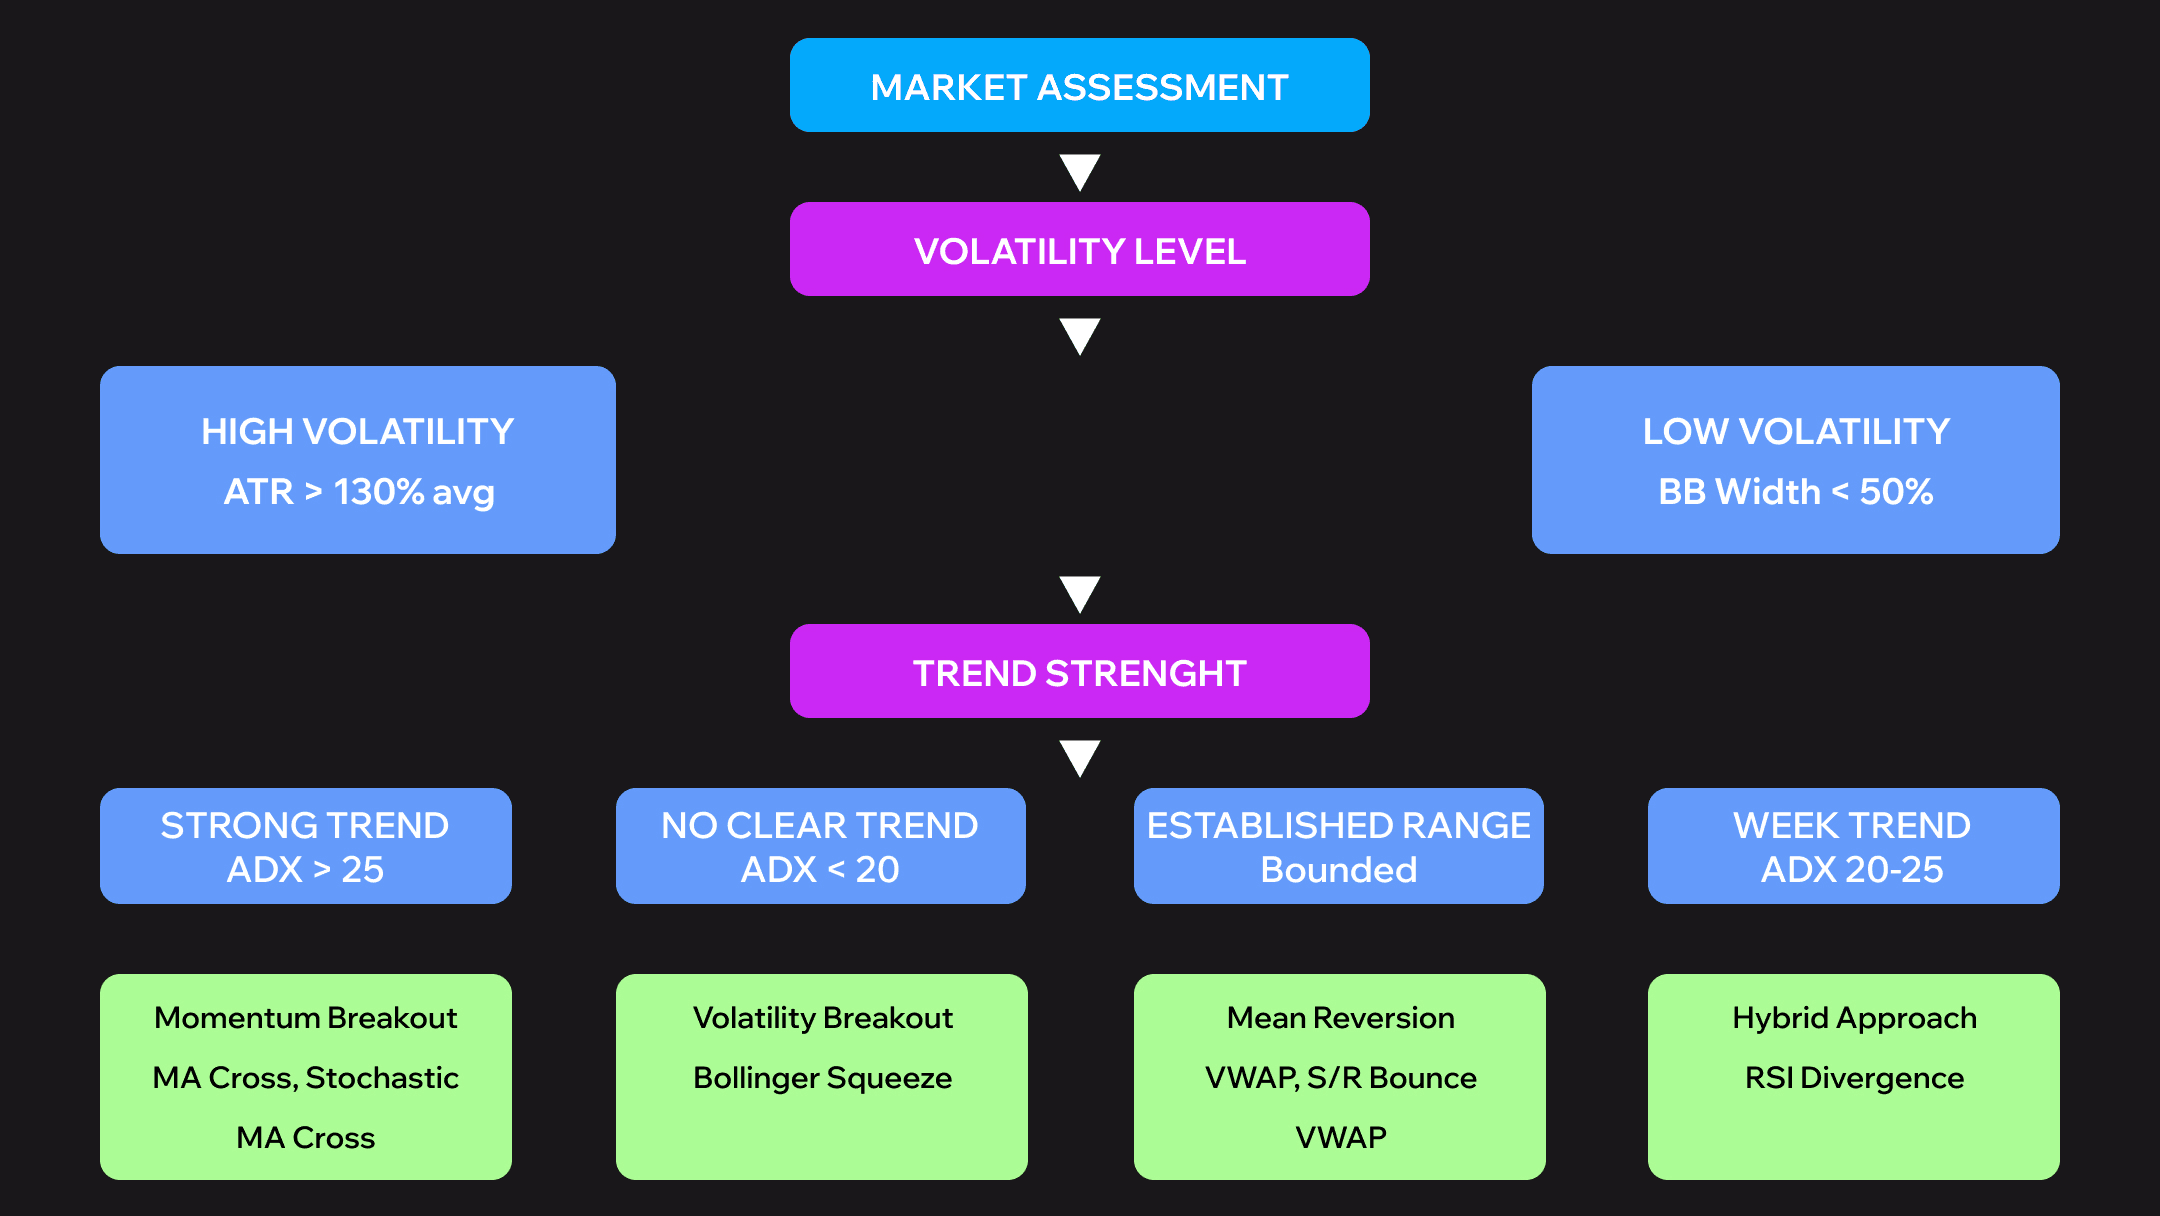
Framework Structure:
- High Volatility + Strong Trend → Momentum breakout strategies
- High Volatility + No Clear Trend → Volatility breakout strategies
- Low Volatility + Established Range → Mean reversion strategies
- Moderate Volatility + Weak Trend → Hybrid approaches
Quantifiable Thresholds:
Strong Trend = ADX above 25. High Volatility = Current ATR exceeds 130% of 20-period average. Range-Bound = Bollinger Band width below 50% of 3-month average.
 Forcing momentum strategies onto ranging markets destroys accounts. Trying mean reversion during strong trends creates losses. Match your method to conditions. Start each session with a 5-minute market assessment. Check ADX for trend strength. Measure ATR for volatility. Observe Bollinger Band width. Then select your strategy arsenal for the day.
The Best Scalping Strategies: Complete Implementation Guide
Eight complete strategies follow. Each provides exact specifications. You'll get timeframes, indicator settings, entry rules, exit criteria, optimal instruments, and expected performance.
Strategy #1 - Moving Average Crossover Strategy
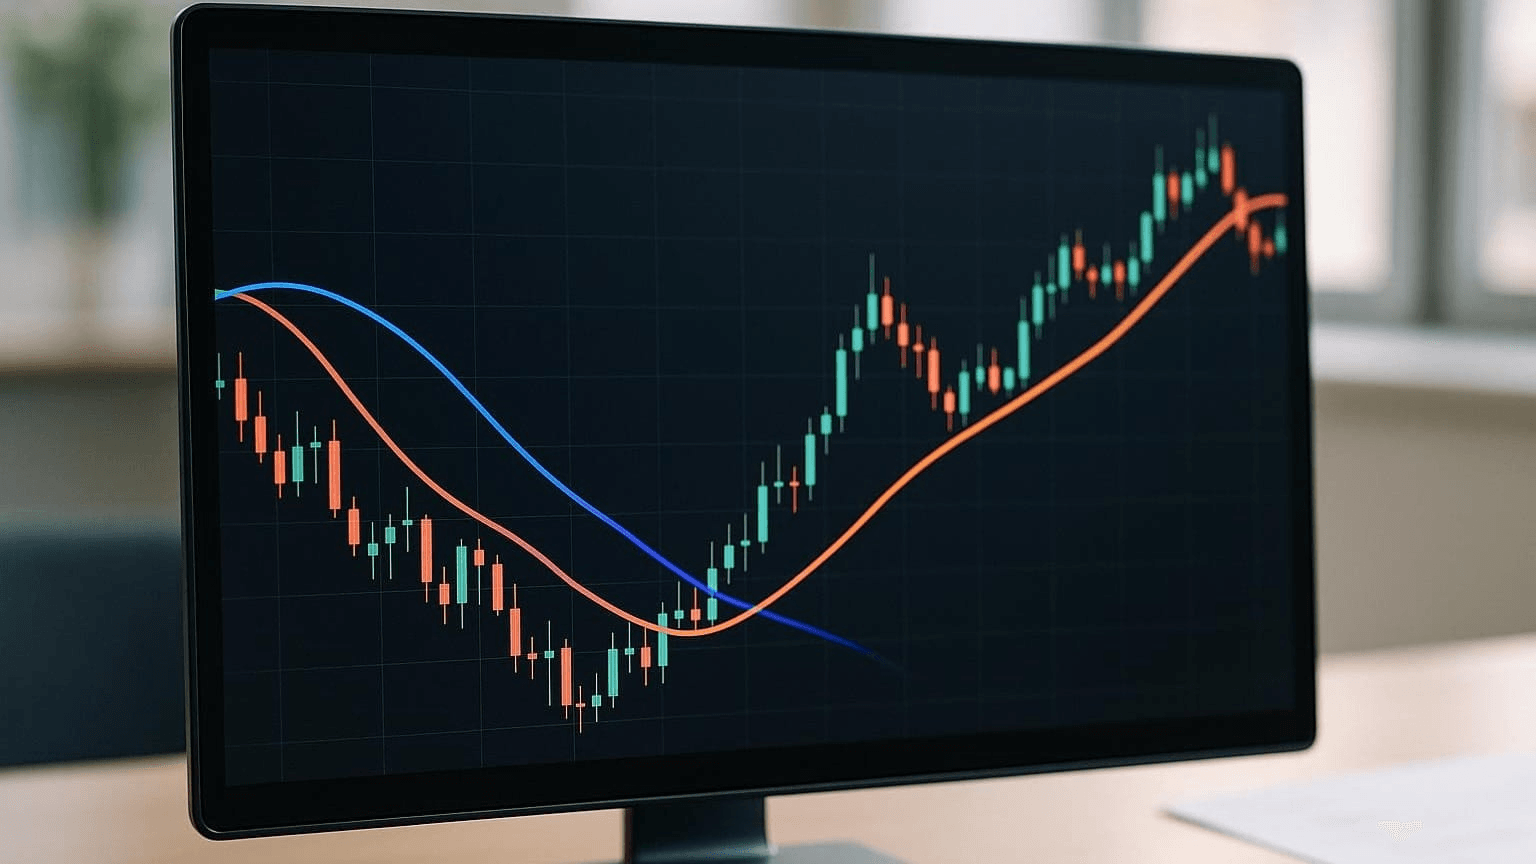 Timeframes: 5-minute analysis, 1-minute execution
Indicators: 8 EMA, 21 EMA, Volume (20-period average), RSI(7)
Entry (LONG): 8 EMA crosses above 21 EMA on 5-min. Both EMAs are sloping upward. RSI(7) above 50. Volume exceeds 120% average. Price pulls back to 8 EMA on 1-min. Enter on bounce with a bullish candle.
Exit: Target 1.5x ATR(14). Exit if 8 EMA crosses back below 21 EMA. Time-based exit after 20 minutes.
Stop Loss: 0.5x ATR(14), typically 5-8 pips EUR/USD
Risk-Reward: 1:1.5 minimum, targeting 1:2
Optimal Instruments: EUR/USD, GBP/USD, USD/JPY (London/NY overlap). BTC/USDT, ETH/USDT. SPY, QQQ, high-volume tech stocks.
Performance: 58-63% win rate. 1.7-2.1 profit factor. 8-15 minutes average duration. 8-15 trades per session.
Best Conditions: Clear trending markets with momentum during major session overlaps.
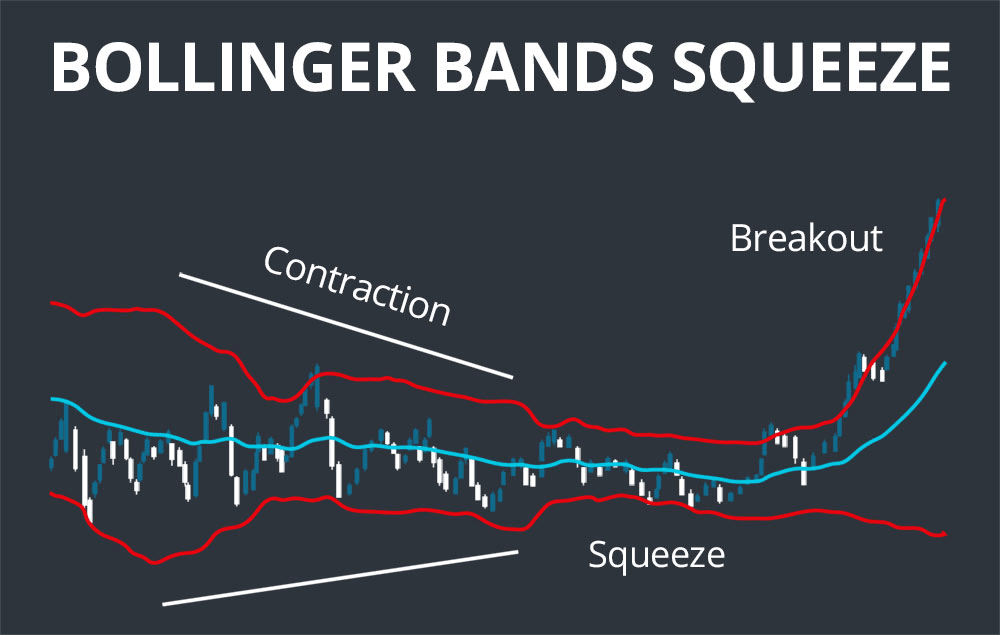
Strategy #2 - Bollinger Band Squeeze Strategy
 Timeframes: 3-minute primary
Indicators: Bollinger Bands (20,2), BB Width indicator, MACD (12,26,9), Volume (20-period average)
Entry (LONG): BB Width reaches 3-month low. Bands begin expanding. Price closes outside upper BB. MACD histogram turns positive and increasing. Breakout candle volume exceeds 150% average. Enter the next candle at market or limit at previous high.
Exit: Target opposite BB (full band width move). Alternative 2x ATR if the band is too wide. Move stop to breakeven after 1x ATR profit. Time limit 25 minutes.
Stop Loss: Inside squeeze range, typically 0.7x ATR
Risk-Reward: 1:2 to 1:3 (band width dependent)
Optimal Instruments: Major forex pairs during pre-news periods. ETH/USDT, BNB/USDT during consolidation. AAPL, MSFT, TSLA intraday consolidations.
Performance: 55-60% win rate. 2.0-2.5 profit factor. 12-20 minutes duration. 3-6 quality setups per session.
Best Conditions: Low volatility consolidation periods before expansion.
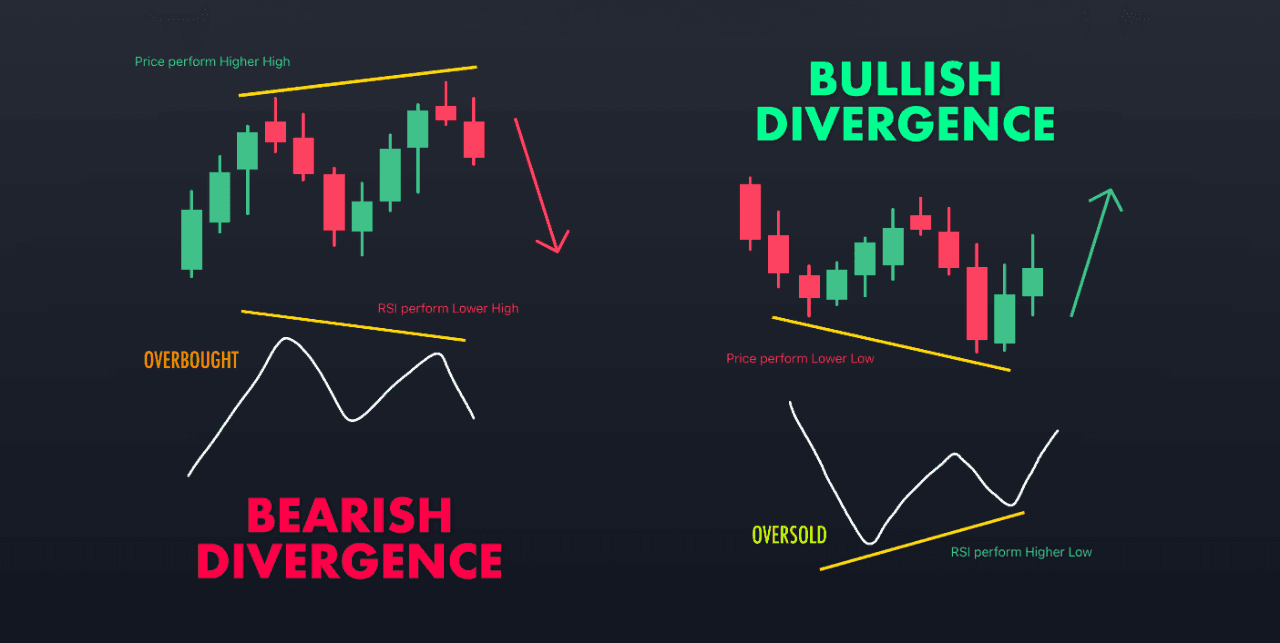
Strategy #3 - RSI Divergence Trading Strategy
 Timeframes: 5-minute for divergence identification, 1-minute for entry timing
Indicators: RSI(7), Price action (swing highs/lows), 50 EMA, Stochastic(5,3,3)
Entry (LONG - Bullish Divergence): Price below 50 EMA making lower lows. RSI simultaneously making higher lows (divergence). Price reaches support or RSI below 30. Wait for RSI to cross above 30. Stochastic crosses up from oversold on 1-min. Enter with bullish candle confirmation.
Exit: Primary target 50 EMA. Alternative 1.5x ATR if EMA distant. Close 50% at 1x ATR, hold 50% to target. Exit if divergence invalidates.
Stop Loss: Beyond swing extreme (support level)
Risk-Reward: 1:2 minimum, often 1:3+
Optimal Instruments: GBP/JPY, EUR/JPY. Altcoins during corrections. Individual stocks during intraday pullbacks.
Performance: 65-70% win rate. 2.3-2.8 profit factor. 15-30 minutes duration. 2-4 high-quality setups per session.
Best Conditions: Corrective phases within larger trends, overextended markets.
Mastering Complex Strategies with Professional Infrastructure
Complex multi-indicator strategies demand a proper trading environment. Most scalpers face barriers: insufficient capital for position sizing, lack of institutional-grade execution, challenges managing real-time risk across strategies. Upscale.trade eliminates these obstacles with institutional infrastructure designed for high-frequency trading. Access the capital and technology to implement sophisticated scalping approaches effectively across crypto and traditional markets. Professional tools enable strategy execution with optimal quality and comprehensive analytics for continuous refinement. Focus on trading — not infrastructure concerns.
Strategy #4 - VWAP Mean Reversion Strategy
 Timeframes: 2-minute chart
Indicators: VWAP (standard), VWAP deviation bands (1σ, 2σ), Volume, 20 EMA
Entry (LONG): Price deviates 2+ standard deviations below VWAP. Volume spike confirms overextension (200%+ average). Price shows rejection wicks (buying pressure). Enter when price closes back inside the 2σ band heading toward VWAP. 20 EMA supports direction.
Exit: Primary VWAP line. Extended to the opposite 1σ if momentum strong. Move to breakeven at +50% profit. Time-based exit after 20 minutes.
Stop Loss: Beyond 2.5σ band (setup invalidation)
Risk-Reward: 1:2 to 1:4 (deviation dependent)
Optimal Instruments: High-volume stocks (AAPL, MSFT, AMZN). BTC/USDT during regular hours. ES, NQ futures during liquid sessions.
Performance: 62-68% win rate. 2.4-3.0 profit factor. 10-18 minutes duration. 4-8 opportunities per session.
Best Conditions: Normal distribution days, avoid major news events.
Strategy #5 - Support and Resistance Bounce Strategy
 Timeframes: 15-minute for level identification, 1-minute for entry precision
Indicators: Horizontal S/R levels, Price action patterns, Volume, Optional 200 SMA
Entry (LONG at Support): Identify tested support from 15-min (minimum 3 prior touches). Price approaches on decreasing momentum. Wait for rejection pattern on 1-min: hammer, bullish engulfing, pin bar (lower wick 2x+ body length). Volume on rejection exceeds 130% average. Enter at rejection candle close or next open.
Exit: Target mid-range or next technical level. Alternative 2x ATR. Trail to breakeven after 1x ATR profit. Exit if price closes beyond level.
Stop Loss: 3-5 pips beyond S/R level (tight)
Risk-Reward: 1:2 to 1:3
Optimal Instruments: EUR/USD, USD/JPY during Asian/London. BTC/USDT, ETH/USDT at established levels. High-liquidity stocks with clear ranges.
Performance: 60-65% win rate. 2.0-2.6 profit factor. 10-20 minutes duration. 3-7 level tests per session.
Best Conditions: Range-bound markets, avoid strong breakouts.
Strategy #6 - Stochastic Momentum Strategy
 Timeframes: 3-minute primary
Indicators: Stochastic (5,3,3), 21 EMA, ADX(14), Volume
Entry (LONG): Price above 21 EMA (trend filter). ADX above 20 (strength filter). Stochastic drops into oversold (below 20). K crosses above D while oversold. Volume on cross exceeds average. Enter at market on cross completion.
Exit: Primary opposite stochastic cross (K crosses back below D). Alternative stochastic reaches opposite extreme (80+ for longs). Profit target 1.5x ATR if no cross. Time limit 15 minutes.
Stop Loss: Recent swing low/high on 3-min, typically 0.6x ATR
Risk-Reward: 1:1.5 to 1:2
Optimal Instruments: All major forex pairs during trends. Major crypto pairs during directional moves. Momentum stocks during trend hours (10 AM-2 PM).
Performance: 57-62% win rate. 1.8-2.3 profit factor. 8-12 minutes duration. 10-18 opportunities per session (high frequency).
Best Conditions: Trending intraday environments with periodic pullbacks.
Strategy #7 - News Spike Fade Strategy
 Timeframes: 1-minute for rapid execution
Indicators: Economic calendar, ATR(14), Bollinger Bands (20,2), Volume, RSI
Entry (FADE - Contrarian): Identify high-impact news (NFP, CPI, Fed decisions). Allow initial spike (first 1-3 minutes post-release). Wait for the first pullback candle. Spike magnitude must exceed 2x average ATR. Enter counter-trend when: price shows rejection candle, volume declining from peak, RSI shows divergence from extreme.
Exit: Target 50% retracement of spike (Fibonacci 50%). Alternative pre-news level. Aggressive 61.8% retracement if momentum is strong. Emergency exit if new extreme beyond spike.
Stop Loss: Beyond spike extreme plus 5 pips
Risk-Reward: 1:2 to 1:4 (spike dependent)
Optimal Instruments: Forex pairs directly affected (USD pairs for US data). BTC/USDT during major announcements. Avoid stocks (gaps).
Performance: 52-58% win rate. 2.5-3.5 profit factor. 20-45 minutes duration. 1-3 major events daily.
Best Conditions: High-impact scheduled news with clear overreactions.
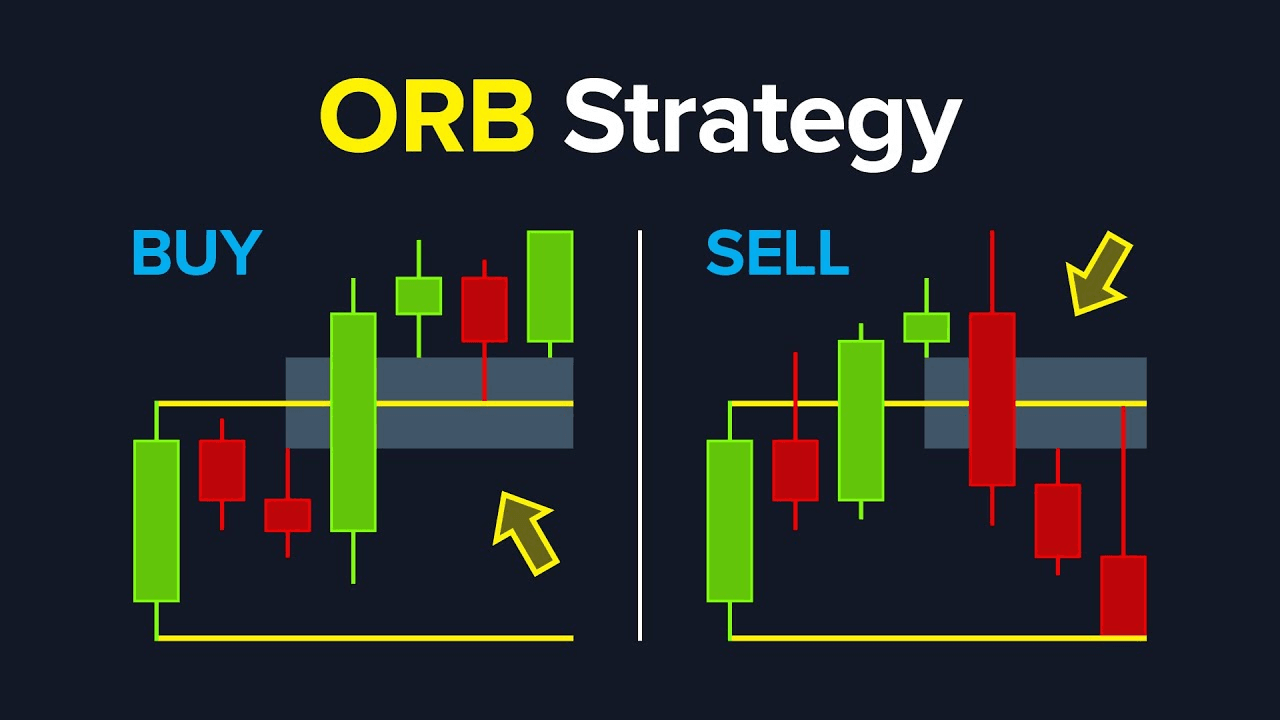
Strategy #8 - Opening Range Breakout (ORB) Strategy
 Timeframes: 30-minute for range establishment, 2-minute for entry execution
Indicators: First 30-min high/low (09:30-10:00 EST stocks, 08:00 GMT forex), ATR(14), Volume profile
Entry (LONG - Upside Breakout): Mark first 30-minute high/low. After 10:00 AM, wait for the price to approach range high. Breakout requirements: strong close above (not just wick), volume exceeds 150% opening range average, no immediate rejection (next candle continues). Enter at breakout close or next open.
Exit: Target 100% of opening range height projected from breakout. Alternative 2x range height if momentum is exceptional. Move to breakeven after 50% target achieved. Close before lunch (12:00 PM).
Stop Loss: Inside range, typically at midpoint
Risk-Reward: 1:2 typical (range dependent)
Optimal Instruments: SPY, QQQ, high-volume stocks. ES, NQ futures. Major forex at London open. Crypto is less reliable (24/7).
Performance: 55-62% win rate. 2.1-2.7 profit factor. 30-90 minutes duration. 1-2 trades per morning.
Best Conditions: High volatility days, trending markets, post-weekend/post-news.
Advanced Strategy Combinations and Hybrid Approaches
Professional scalpers combine multiple strategies for higher-probability setups. Confluence concept: Multiple independent signals increase probability significantly.
Hybrid #1: Triple Confirmation System
Combine MA crossover (trend direction), VWAP deviation (entry timing), Stochastic position (momentum confirmation). Trade only when all three align. Reduces signals by 70% but improves win rate from 58% to 74%.
Example: 8 EMA crosses above 21 EMA. Price deviates 2σ below VWAP. Stochastic crosses up from oversold. Entry combines trend, value, momentum.
Hybrid #2: Structure + Momentum Fusion
Merge S/R levels (price zones) with RSI divergence (reversal timing). Result: High-probability reversals at key levels with momentum confirmation.
Hybrid #3: Volatility Breakout + Mean Reversion
Use Bollinger squeeze to identify compression. Apply VWAP strategy during expansion. Captures both breakout and subsequent reversion.
Performance Comparison:
| Approach | Win Rate | Profit Factor | Signals/Day |
|---|---|---|---|
| Single Strategy | 58% | 1.9 | 12 |
| Hybrid (2 filters) | 67% | 2.4 | 6 |
| Hybrid (3 filters) | 74% | 3.1 | 3 |
More filters equals fewer signals but higher quality. Trade less, win more. Start with single strategies. Master individually. Then experiment with combinations.
Strategy Performance Comparison and Selection Guide
Which strategy to start with? Complete comparison across key metrics:
| Strategy | Win Rate | Profit Factor | Trades/Day | Difficulty | Capital |
|---|---|---|---|---|---|
| MA Crossover | 60% | 1.9 | 10-15 | Beginner | Low |
| BB Squeeze | 58% | 2.3 | 3-6 | Intermediate | Medium |
| RSI Divergence | 68% | 2.6 | 2-4 | Advanced | Medium |
| VWAP Reversion | 65% | 2.7 | 5-8 | Intermediate | Medium |
| S/R Bounce | 63% | 2.2 | 4-7 | Beginner | Low |
| Stochastic | 60% | 1.9 | 12-18 | Beginner | Low |
| News Fade | 55% | 3.0 | 1-3 | Expert | High |
| Opening Range | 59% | 2.4 | 1-2 | Intermediate | Medium |
Selection Guide:
Beginners with limited capital: Start MA Crossover or S/R Bounce. Intermediate experience and moderate capital: Try VWAP or BB Squeeze. Experienced with substantial capital: Implement RSI Divergence or News Fade. Prefer high-frequency: Deploy Stochastic or MA Crossover. Prefer selective high-probability: Focus RSI Divergence or BB Squeeze.
Strategy Optimization and Backtesting Methodology
Theory means nothing without testing. Systematic approach to validating strategies before risking capital:
Step 1: Historical Data Collection - Minimum 6 months data. Include various conditions (trend/range/volatile). Tick data preferred, 1-minute minimum for scalping.
Step 2: Parameter Testing - Test indicator parameters (EMA periods, RSI settings). Use optimization software (TradingView, AmiBroker, Python). Avoid over-optimization (20+ parameters = curve fitting risk).
Step 3: Walk-Forward Analysis - Optimize on 70% of data (training). Test on remaining 30% (out-of-sample verification). Roll forward repeatedly. Strategy must perform on out-of-sample periods. If only works on training data, you've curve-fit.
Step 4: Monte Carlo Simulation - Randomize trade sequences. Measure maximum drawdown across 1000+ simulations. Ensure strategy survives unlucky periods. If the 95th percentile drawdown exceeds 25%, the strategy is too risky.
Step 5: Live Demo Testing - 2-3 months real-time paper trading. Match backtested results within 15-20%. Adjust for slippage/commissions.
Warning: Strategy working in backtest but failing live usually indicates: overfitting, insufficient slippage modeling, or market regime change.
Real-World Strategy Implementation: Case Studies
Theory becomes reality through execution. Three detailed examples showing complete trade sequences.
Case Study #1: MA Crossover (EUR/USD) - London session, trending day. 8 EMA crossed 21 EMA at 1.0845. Entry on pullback to 8 EMA at 1.0838 with RSI confirmation. Stop 1.0833 (6 pips). Target 1.0848 (9 pips). Position held 11 minutes. Target hit cleanly. Result: +9 pips per standard lot. Analysis: Strong trend created ideal conditions. Clean pullback provided low-risk entry.
Case Study #2: VWAP Reversion (BTC/USDT) - US hours, normal distribution day. Price spiked to $41,250 (2.3σ below VWAP at $41,680). Volume spike to 240% average. Entry $41,280 on rejection. Stop $41,150. Target VWAP $41,680. Held 18 minutes. Target reached. Result: +$395 per BTC contract. Analysis: Textbook overextension with volume confirming exhaustion.
Case Study #3: RSI Divergence (AAPL) - Mid-morning, intraday correction. Price higher high $178.65. RSI lower high (divergence). Entry short $178.40 on stochastic confirmation. Stop $178.75. Target 50 EMA $177.55. Held 24 minutes. Result: +$0.82 per share. Analysis: Patience waiting for divergence paid off.
Common Strategy Mistakes and How to Avoid Them
Even the best strategies fail when executed incorrectly.
Mistake #1: Trading Every Signal - Problem: Taking 80% of signals instead of best 20%. Solution: Add confluence filters, reduce frequency, improve selectivity. Impact: Win rate improves 8-12% with half the trades.
Mistake #2: Inconsistent Parameters - Problem: Changing EMA periods, RSI settings mid-session. Solution: Lock parameters for minimum 100 trades before adjustment. Impact: Enables proper strategy evaluation.
Mistake #3: Ignoring Market Regime - Problem: Using momentum strategy in range-bound markets. Solution: Daily market assessment before session, strategy selection based on conditions. Impact: Eliminates 40% of losing trades.
Mistake #4: Premature Position Sizing - Problem: Using full size before strategy is proven. Solution: 25% size first 50 trades → 50% next 50 → full size after 100+. Impact: Limits learning-phase drawdown.
Mistake #5: No Post-Trade Review - Problem: Repeating the same mistakes. Solution: Journal every trade, weekly pattern analysis. Impact: Identifies personal execution weaknesses.
Strategy Adaptation for Different Markets
Forex, crypto, and stocks have unique characteristics. Adapt strategies accordingly.
Forex Adaptations: Best strategies: MA Crossover, VWAP, Stochastic Momentum. High liquidity supports high frequency. Tight spreads enable scalping. Optimal pairs: EUR/USD, GBP/USD, USD/JPY. Standard parameters work well. Focus London/NY overlap (08:00-12:00 EST). Considerations: spread sensitivity, swap fees (rare for scalpers), major news impact.
Crypto Adaptations: Best strategies: VWAP Mean Reversion, Bollinger Squeeze, RSI Divergence. Volatility-focused strategies match explosive moves. Optimal: BTC/USDT, ETH/USDT only (liquidity essential). Avoid low-liquidity altcoins. Parameter adjustments: wider stops (+30%), larger targets (+40%). Focus US hours (09:00-16:00 EST) despite 24/7 markets. Considerations: exchange risk, funding rates, weekend volatility, sudden regulatory news.
Stock Adaptations: Best strategies: Opening Range Breakout, S/R Bounce, News Fade. Optimal: SPY, QQQ, high-volume stocks (AAPL, MSFT, TSLA). Account for wider spreads, commissions. Respect Pattern Day Trader rule ($25k minimum). Focus first 2 hours post-open (09:30-11:30), power hour (3-4 PM). Avoid lunch. Considerations: gap management, earnings announcements, sector rotation.
Conclusion: From Strategy Knowledge to Consistent Execution
You now possess 8 complete scalping strategies with exact specifications. Each strategy was tested for performance, risk management, and compatibility with Upscale.trade advanced tools, enabling traders to scale their operations with transparent profit-sharing terms. But knowledge means nothing without execution. Critical success factors: Strategy Selection (match to personality), Rigorous Testing (100+ demos), Disciplined Execution (follow rules), Continuous Optimization (weekly review), Psychological Mastery (independent events).
Implementation Roadmap: Week 1 - Select 2 strategies, create checklists. Month 1-3 - Demo trade extensively (100+ trades per strategy). Month 4 - Optimize and refine. Month 5+ - Begin live with 25% size, scale gradually.
Best strategies fail with poor execution. Professional trading is systematic, not sporadic. Strategy knowledge is the starting point. Consistent application is the destination. Your scalping journey starts now.
FAQ
1. What is the best scalping strategy for beginners?
Start with Moving Average Crossover or Support/Resistance Bounce. Clear visual signals, low capital, 60-63% win rates.
2. How many scalping strategies should I use simultaneously?
Master 1-2 strategies maximum initially. Total arsenal: 4-5 maximum when experienced.
3. What win rate is realistic for scalping strategies?
55-70% realistic range. High-frequency (55-60%). High-selectivity (65-70%). Focus profit factor over win rate.
4. How long does it take to master a scalping strategy?
3-6 months focused practice for genuine mastery. Month 1: Learning. Month 2-3: Competence. Month 4-6: Proficiency.
5. Can scalping strategies be automated?
Partially yes. Mechanical strategies (MA Crossover) automate relatively well. Complex discretionary (RSI Divergence) difficult to fully automate.
